


The Zhitong Finance App learned that Kerry Real Estate Research published an article stating that in October, the launch promotion in key cities continued the “small-batch, multi-batch promotion” strategy. Among the key cities monitored by the report, 202 projects launched a total of 19736 properties; 179 projects under a comparable scale launched a total of 16,997 units and subscribed for about 7,769 units. The overall opening and removal rate was about 45.7%, an increase of about 3.1 percentage points over the previous month. Market margins have stabilized, and the differentiation between cities and projects is still remarkable.
Table 1 Deletion of opening projects in key cities in October 2026
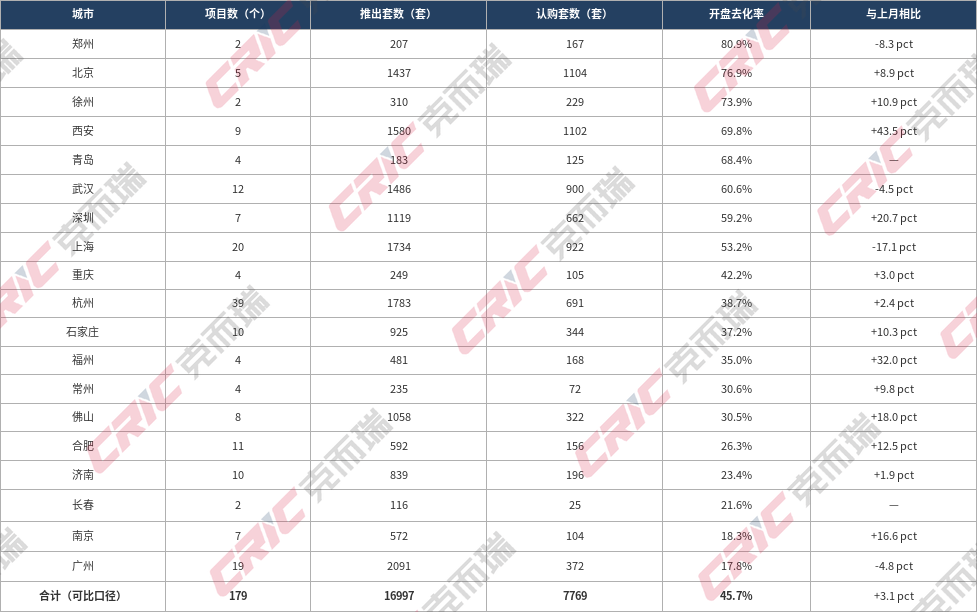
Note: Excluding direct resales/flat promotion projects in Shanghai and Zhengzhou (no effective removal rate); “Compared with the previous month” is the difference between the comparable weighted removal rate of the same city last month (newly monitored cities are represented by “—”).
Source: Curie Research Center and intercity agency research summary.
Table 2 Key City Estimation - Elimination Matrix

Note: The boundary is based on the median number of units launched this month (839 sets) and the total sample removal rate (45.7%); the cells are in order by number of cities, number of projects, number of units launched, weighted removal rate, and subscription share of the comparable sample.
Source: Compiled by the Kerry Research Center.
Overall market characteristics:
1. The total volume is characterized by “shrinking volume and quality”: in October, the number of comparable push sets shrank 24.5% month-on-month, and subscription packages decreased 19.0% month-on-month; subscription revenue shrank due to contraction in supply, and the recovery rate of elimination was mainly driven by faster contraction on the supply side (denominator narrowing) at the total level, and the overall demand side was still weak.
2. Urban differentiation is obvious and does not fully correspond to energy levels. Six cities, including Zhengzhou, Beijing, Xuzhou, Xi'an, Qingdao, and Wuhan, had the highest removal rates and outstanding performance, while Nanjing and Guangzhou were at the bottom of less than 20%. Compared with September, 13 of the comparable cities rebounded and 4 cities declined, and the heat and cold between cities continued unevenly. Divided by the median number of units launched this month (839 sets) and the total sample removal rate (45.7%), the five “high speculation and high removal” cities of Beijing, Xi'an, Wuhan, Shenzhen, and Shanghai contributed 60.4% of the subscription; the “high volume and low removal” cities of Hangzhou, Shijiazhuang, Foshan, Jinan, and Guangzhou contributed only 24.8% of the subscription. The mismatch between supply and demand was the main cause of this month's decontamination pressure.
3. Promotion and product structure: The scale of single marketing is still dominated by small to medium batches (≤100 projects accounting for 67.6% of the comparable sample), and large-scale initial sales are limited; products are mainly improved and immediate demand. Core cities are undergoing initial reforms of 110 to 140 square meters and improved products of 140 square meters or more are concentrated in the market, highlighting the scarcity of high-end large apartments in some cities.
4. There is a clear gap between projects. The highest elimination rate in this phase was 100%, the lowest was 0%, and the interval span reached 100 percentage points; of the 179 comparable projects, 46 eliminated less than 15%, accounting for 25.7%, and nearly 33.5% of the projects were eliminated less than 20%.
5. Characteristics and commonalities of popular projects: The 15 projects with a removal rate of ≥ 90% in this phase are highly concentrated in core areas of core cities. They generally have the characteristics of “strong location+strong brand+scarce products/reasonable pricing”, indicating that real demand is still concentrated on high-certainty assets.
Table 3. Some popular projects in key cities in October 2026
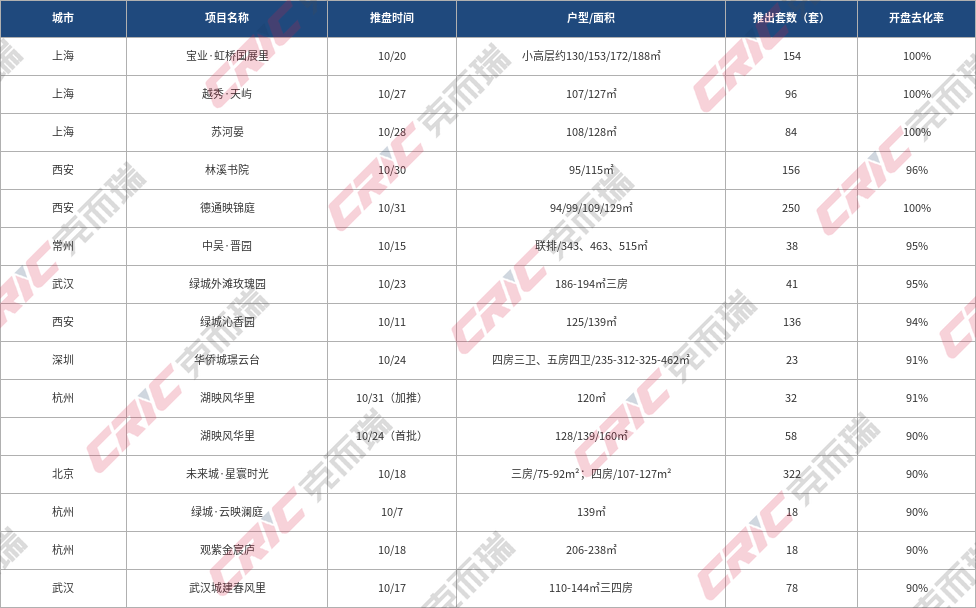
Source: Curie Research Center and intercity agency research summary.
Structural characteristics
(1) Comparison of the deactivation performance of the first launch and promotion projects
Table 4 Comparison between initial opening and removal of new projects in key cities

Note: According to comparable caliber (same as Table 1); “Compared with the previous month” is the difference in weighted removal rate with the same caliber in September.
Data source: Compiled by the Kerry Research Center.
1. Overall, the removal rate of the initial project was significantly superior to the promotion, with a weighted removal rate of 63.5%, which was about 31.2 percentage points higher; however, the difference was mainly due to the distribution of project texture and weight, not the “first opening” label itself — the average promotion of the first single plate was larger (about 170 sets/plate, plus about 71 sets/plate), and the initial launch of a strong location and strong brand contributed to the main subscription.
2. “Fewer, more concentrated, and highly scattered”: 43 initial launches in the current period, accounting for 24% of the number of comparable projects, 42.9% of the number of launches, and 59.6% of the subscription volume; the removal rate range is 0% to 100%, with a span of 100 percentage points. Among them, there is no shortage of initial projects with low elimination.
3. Degradation of promotion projects is “low concentration, stable, medium to low”: 136 promotion projects account for 57.1% of the comparable sample launch volume, but their weighted removal rate is only 32.3%, which is the main drag on the overall removal rate; there is also no shortage of high removal samples (such as Shanghai Baoye · Hongqiao Guozhanli, etc.), indicating that promotion and removal are more dependent on existing reputation, cost performance ratio and location conditions of remaining listings.
4. Structural meaning: The opening batch itself is not the deciding factor of elimination; whether the price matches the actual demand of the product is the key. On a month-on-month basis, the initial removal rate increased slightly by 0.6 percentage points compared to the previous month, and the removal rate rebounded 4.5 percentage points from the previous month, and the initial lead was maintained above 30 percentage points. The share of initial projects decreased by 3 percentage points compared to the previous month, and the pace of new market entry has slowed slightly. The final risk mainly comes from the fueling side: the inefficient supply on the promotion side is more concentrated, and the removal rate of 77 projects under promotion is less than 30%, accounting for 59.7% of the total number of promoted units, contributing only 24.8% of the subscriptions; only 10 of the initial projects are less than 30%, and the total subscription accounts for only 2.9% of the initial subscription.
(2) Area segment: Improvement in the middle and strengthening of the dominant pattern
Table 5. Comparison of the main area segments promoted by key cities

Data source: Compiled by the Kerry Research Center.
The area section of this period showed a different structure from the past: 110-140 square meters had the best removal rate, a weighted removal rate of 52.2%, 6.5 percentage points higher than the total sample, an improvement of 140 square meters or more, and the middle of large apartments above 200 square meters; less than 110㎡ was the weakest, and the weighted removal rate was only 21.3%, which was 24.4 percentage points lower than the total sample. Against the backdrop of weak demand, small apartments in the remote suburbs are under pressure. The middle improvement period is more stable because it meets replacement and quality requirements, and the area is not “the smaller the better”. Looking at the month-on-month comparison, the 110-140 square meter first section was the only area segment that showed a significant recovery. The immediate demand section below 110 square meters and the large apartment segment above 200 square meters both weakened, and the dominant pattern of “strong in the middle and weak at both ends” was further strengthened.
(3) Total price segment: the high-end is strong, the low total price is weak, and the middle segment is weak
Table 6. Comparison of total price segments promoted in key cities
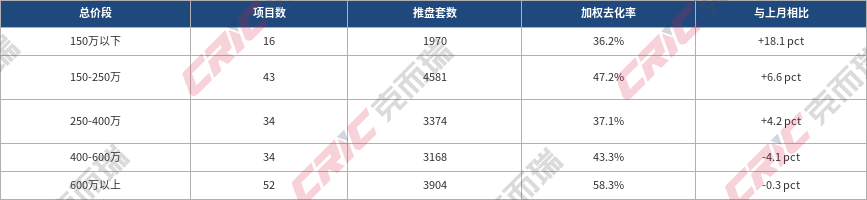
Note: Total price = average transaction price (the range takes the lower limit) × the main area (the range takes the median value). This is an estimated value and is for classification reference only.
Data source: Compiled by the Kerry Research Center.
There is a nonlinear relationship between the total price and removal rate: the price segment above 6 million yuan has the highest removal rate, mostly supported by scarce products or high-net-worth customers in the core area; the price range of 2.5 to 4 million yuan is a relatively collapsed area, and the absolute low is still below 1.5 million. The immediate purchasing power is insufficient, and customers are more willing to increase their budget to choose the core location. The mismatch between supply and demand is most obvious. On a month-on-month basis, the recovery in the removal rate was concentrated on the lower total price side. The structural characteristics of the recovery were the release of immediate demand and low total price demand under “price in exchange for volume,” and the high-end market did not pick up at the same time. Among them, the removal of the lower total price segment of less than 1.5 million yuan was 18.1 percentage points higher than last month, which is in line with the target of policies such as interest rate discounts and housing purchase subsidies, which mainly target customers in need of the first package.
(4) Push plate size: The larger the size of a single push, the better the elimination
Table 7. Comparison of market sizes in key cities

Data source: Compiled by the Kerry Research Center.
The scale of single market sales is positively correlated with the removal rate: the lowest elimination rate for projects with less than 50 sets, and the highest removal rate for projects above 180 sets. Larger projects are mostly first launched or promoted centrally by strong brands, which dare to scale up and achieve high elimination; small-batch marketing promotion projects are less likely to be eliminated, which indicates that the scale of the promotion itself is not a drag; the key is the quality of the project.
(5) Elimination rate distribution: polarized, nearly half of projects eliminated less than 30%
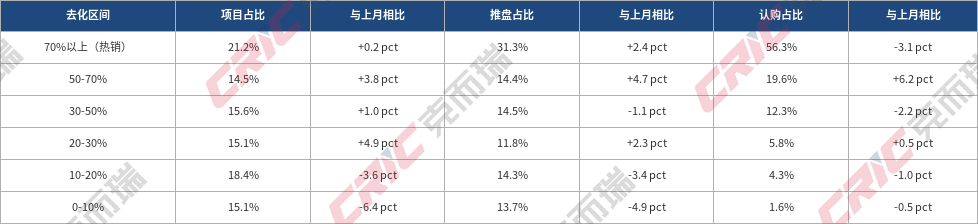
Table 8 Distribution of push plate removal rates in key cities
Data source: Compiled by the Kerry Research Center.
The distribution of removal is still polarized. More than 20% of projects have a removal rate of 70% or more (hot sales), accounting for 31.3%; projects with less than 30% removal account for 48.6% and 39.8% of promotion volume. Compared with the previous month, the share of tail projects with less than 20% elimination narrowed sharply from 43.4% last month to 33.5%, while the share of popular projects remained flat last month, indicating that the overall recovery in the decontamination rate in October was mainly contributed by improvements in middle and tail projects, and the pattern of differentiation eased marginally. In terms of subscription contributions, 21.2% of popular projects contributed 56.3% of the subscription volume, a slight decrease from the previous month; the remaining projects that removed less than 20% contributed only 5.9% in total, and the pattern of concentrating subscriptions to a few high-certainty projects has not changed.
The main influencing factors of dechemical performance
(1) The cost performance ratio and location of the project are the primary factors that determine removal
The difference in demineralization within the same city is obvious. Taking Shanghai as an example, the Suheyan project was 100% eliminated, while the new Fenglanjing in the same city was only 6%; reflecting the scarcity of the core area, the customer's ability to pay and match the product was even higher. Simply low price did not equal good sales; location, support, product strength and price were as critical.
(2) The size of the push plate and product structure have a significant impact on overall elimination
The two cities of Nanjing and Guangzhou launched a total of 2,663 units, accounting for 15.7% of the comparable sample volume, but the weighted elimination rate was only about 17.9%. In the context of weak demand, concentrated promotion, improvement, and high total price products will clearly lower the overall level of elimination; while cities such as Zhengzhou, Beijing, and Xi'an have achieved higher levels of removal through high-quality supply in core locations, indicating that supply quality is more critical than supply quantity.
(3) Policy impact: Policy underpinning effects are marginal, but are unevenly transmitted
October coincided with the National Day marketing window. Many cities continued policies such as “price for volume” and housing purchase subsidies, housing ticket placement, and reduction in interest rates on existing mortgages, which provided some support for the elimination of immediate needs and improvement projects in some cities. The overall removal rate rebounded slightly from September. However, it will still take time for the effects of the policy to be transmitted, and regional differentiation is remarkable: the core sectors of high-energy cities and strong brand projects benefit more clearly; the boost from low-energy and remote suburban projects is limited, and Nanjing and Guangzhou are still at a trough. In the future, it is necessary to focus on observing the expansion of cities where subsidies and interest rate cuts have been implemented and the efficiency of implementation.
Summary and outlook
The opening and removal rate of key cities rebounded marginally this month, but the differentiation between cities and projects remains weak; due to “product power and timing priority over cities”, “product alignment × market entry point” is more distinguishable: the market entry and removal rate in early October (including National Day) was only 25.9%, rebounded to 52.3% in the middle and 58.2% in late October. The National Day holiday was dominated by shoppers, and subscription conversion lagged behind the middle to late.
Constraints and risks to be aware of: ① Concentration of removal pressure — removal rates of less than 20% in Nanjing, Guangzhou, etc., less than 20% of comparable projects; ② short-term pulse effect — October is superimposed on the first month of National Day marketing and policy implementation; ③ risk of data fluctuation — the removal rate of Shenzhen, Fuzhou, and Xi'an fluctuates by more than 20 percentage points in a single month. Some cities have small sample sizes and are susceptible to individual market disturbances, and monthly data should not be extrapolated linearly.
1. Short-term judgment: Housing companies' sales promotion in November will still be dominated by “small batches, direct sales promotion”, and the initial launch will remain cautious and focus on a few high-energy cities; under the combination of continued shrinking supply and weak demand, the overall removal rate is likely to fluctuate around the current level. The differentiation between cities will continue, and differences in single market transactions will mainly depend on pricing and product alignment.
2. Project level: The core location, the improved market with price advantages and strong product strength, and the “low total price+mature supporting” demand market are expected to continue to lead the market; the pressure to remove products from remote areas, high total prices, large areas, and lack scarcity is high.
3. Policy level: Focus on the pace of implementation and urban expansion of policies such as interest rates on existing mortgages, loosening purchase restrictions, and housing purchase subsidies. Their release effect on immediate demand and improved demand will directly affect year-end elimination.
4. Follow-up key monitoring indicators: proportion of properties that meet interest discount/subsidy conditions in opening projects; changes in promotion pace and removal differences between initial and additional projects; implementation efficiency of interest discount/subsidy implementation by banks in different cities; opening and elimination rate in mid-late November (non-holiday) to verify the sustainability of real demand after the “Silver Ten” pulse effect subsides.