


- Trinity Industries reported third quarter 2026 results, with revenue of US$535.1 million and net income of US$17.6 million, and earnings per share from continuing operations of US$0.27.
- The nine-month figures indicate stronger profitability for Trinity Industries, with net income of US$140.1 million and higher earnings per share from continuing operations compared with the prior-year period, despite softer reported sales and total revenue.
- We will now look at how Trinity Industries' mixed quarterly profit, alongside stronger nine-month earnings, shapes its broader investment narrative.
Compare Trinity Industries' mixed quarter with other industrial players by scanning our hand picked list of list of solid balance sheet and fundamentals (25 results)
Trinity Industries Investment Narrative Recap
To own Trinity Industries, you need to be comfortable with a rail focused model where leasing and manufacturing both respond to cyclical demand in energy, agriculture, chemicals, and construction. The latest quarter shows that revenue held at US$535.1 million while quarterly earnings softened, so the near term story hinges on how efficiently the Rail Products and leasing units run rather than on pure volume.
The short term swing factor is execution in Rail Products. Management has previously targeted healthier margins for this segment, and the mixed quarter keeps attention on production stability and cost control. The key risk remains exposure to end market slowdowns, which could weigh on new railcar orders and renewals if customer appetite cools.
Fresh numbers for the nine months to September 30, 2026 are central to that thesis. Trinity Industries reported net income of US$140.1 million over this period, with earnings per share from continuing operations above the prior year, even though reported sales and total revenue were softer. That combination puts the focus on how much of recent profit strength came from operations versus one off gains.
For a rail lessor and manufacturer that increasingly leans on portfolio sales and partnership restructurings, this earnings mix matters. If gains from asset sales or restructurings become smaller or less frequent, results could be more exposed to any weaker new build cycle or a lighter backlog. The latest update invites readers to watch how consistently Trinity Industries converts its embedded fleet value into cash flow while still supporting core leasing income.
Trinity Industries Analyst Expectations In Context
Trinity Industries sits at an awkward crossroads in the consensus models. Analysts are assuming revenue stays broadly flat over the next few years while profit margins compress sharply from 17.1% today to 3.0% by 2029. That kind of squeeze can matter more to equity holders than any small shift in reported sales because it affects the cash that is actually left over for investors.
The forecast earnings path underlines that point. Analysts expect Trinity Industries to move from US$348.5 million in earnings today to US$59.3 million by about 2029, with earnings per share projected at US$0.73. That is a drop of roughly US$289 million in profit. It reflects a view that a rail-focused lessor with manufacturing exposure could see thinner returns if gains from portfolio deals shrink and operating margins normalise closer to the low single digits.
Price targets build directly on those assumptions. The consensus view pins Trinity Industries at a 2029 revenue level of US$2.0b and earnings of US$59.3 million, then applies a P/E of 52.9x compared with about 5.7x today and an industry multiple of 24.1x for US machinery peers. That suggests investors would be paying a much higher earnings multiple for a smaller profit pool, so readers may want to think carefully about whether such a re-rating feels realistic for a cyclical railcar lessor and manufacturer.
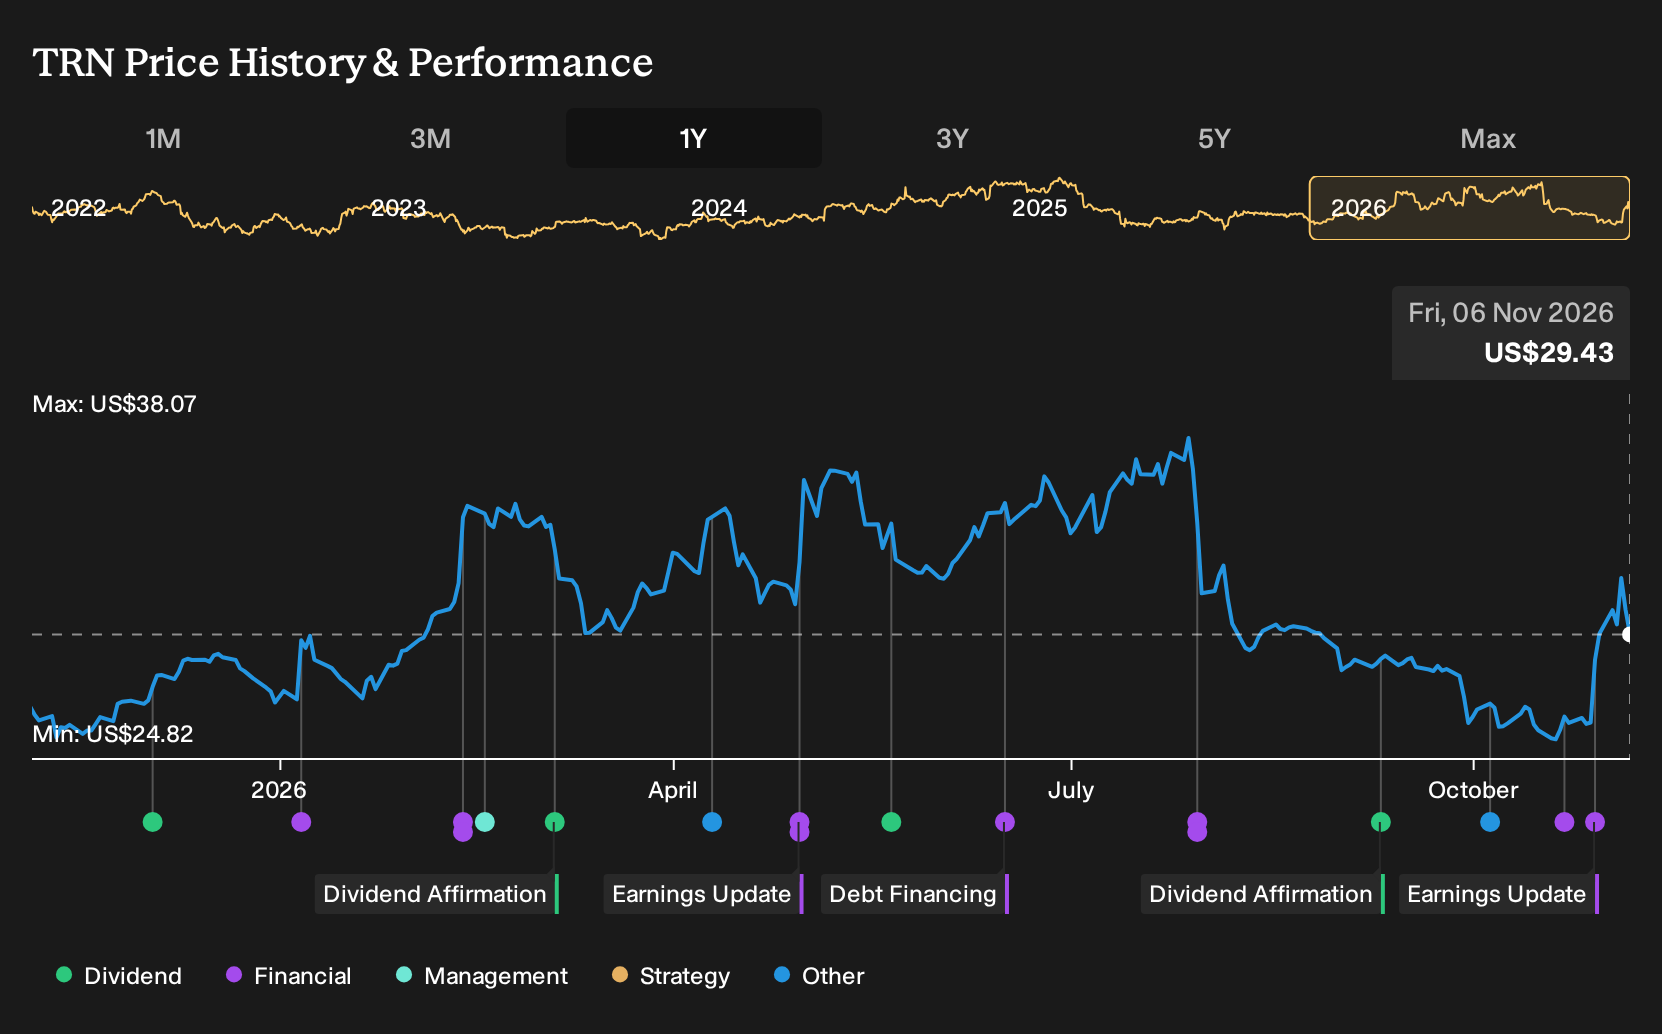
The share count and discount rate details fill in the scaffolding. Analysts are building their models on the idea that Trinity Industries retires around 0.64% of its shares each year over the next three years and that a 9.0% discount rate is appropriate for the risk profile. Those inputs shape the present value of the 2029 earnings stream and help explain how a current share price of US$24.82 lines up against a consensus target of US$31.00, which sits 19.9% higher based on the report cited.
For readers, the takeaway is straightforward. The Street is not assuming robust expansion in revenue or earnings for Trinity Industries but is still anchoring on a higher future valuation multiple and ongoing access to asset sale options. Anyone assessing the stock may want to test how those margin, earnings and P/E assumptions compare with their own view of railcar cycles, residual values and the role of one-off gains in the profit mix.
Trinity Industries' current analyst storyline points to forecast revenue of US$2.0b and projected earnings of US$59.3 million by 2029, with earnings expected to decline by about US$289 million from US$348.5 million today rather than grow.
Uncover why Trinity Industries' fair value indicates a 5% potential upside to its current price that may not last much longer.
Exploring Other Perspectives
Two fair value views from the Simply Wall St Community currently span roughly US$23.61 to US$31 per share, so opinions on Trinity Industries already stretch from modest discount to in line with recent targets. When you add in the risk of weaker railcar demand or thinner Rail Products margins, you can reach very different conclusions. Use that spread to compare several alternative viewpoints before deciding where you sit.
Explore another Trinity Industries fair value estimate, including one that suggests as much as 20% downside from the current price.
Reach Your Own Conclusion
Don't just follow the ticker. Dig into the data and build a conviction that's truly your own.
- A great starting point for your Trinity Industries research is our analysis highlighting 2 key rewards and 5 important warning signs that could impact your investment decision.
- See our latest analysis for Trinity Industries. The report includes a comprehensive fundamental analysis summarized in a single visual, the Snowflake, making it easy to evaluate Trinity Industries' overall financial health at a glance.
Looking For More Investment Ideas Beyond Trinity Industries?
If Trinity Industries has sharpened your focus on risk, return, and balance sheet strength, use that same framework to scan a wider opportunity set with the Simply Wall St Screener.
- For investors who care about quality at a reasonable entry point, check out a curated set of companies trading below their estimated worth through the 38 high quality undervalued stocks.
- If capital preservation sits high on your priority list, focus on businesses with steadier profiles by reviewing a 31 resilient stocks with low risk scores that filters for more resilient balance sheets and risk scores.
- When you want to widen the search to lesser-known opportunities with solid fundamentals, use the 19 high quality undiscovered gems to surface candidates that may not yet be widely followed.
Have feedback on this article? Concerned about the content? Get in touch with us directly. Alternatively, email editorial-team@simplywallst.com