


A rival AI cloud provider just reported very strong AI infrastructure revenue and rising contract prices, and Nebius Group (NBIS) shares quickly reacted, climbing about 7% as traders reassessed recent weakness.
The sharp 1 day share price gain sits against a tougher recent tape for Nebius Group, with the 30 day share price return down 41.43% and the 90 day share price return lower by 29.67%, even as the year to date share price return is 43.96% and the 5 year total shareholder return is 57.78%. Recent headlines have focused on the stock entering oversold territory and on analysts lifting earnings estimates ahead of the next quarterly update. This latest move appears more like traders re-rating the risk and growth narrative than the start of a settled trend.
Spot fast movers around Nebius Group's AI cloud theme by scanning our hand picked 53 AI infrastructure stocks for other potential breakout infrastructure plays.The sharp swing in Nebius Group now collides with a wide gap between the current US$129.49 share price and where both analyst targets and intrinsic value models place it. So where does fair value genuinely cluster within that spread?
Most Popular Narrative: 50% Undervalued
Nebius Group's most followed narrative pegs fair value at roughly $260 per share, roughly double the last close around $129.49. That gap frames today’s jump as a small move inside a much larger valuation debate.
The $260 fair value represents our working estimate of what NBIS could be worth if the company delivers strong AI cloud growth and improves profitability. It should be treated as an upside target rather than evidence that the shares are clearly cheap, because NBIS trades at approximately 42.3 times sales, compared with a peer average of approximately 9.8 times.
See why 30 investors see Nebius Group as 50% undervalued.
Result: Fair Value of $259.97 (UNDERVALUED)
Still, the Nebius Group story can break if AI Cloud margins compress or if the planned US$5b convertible funding results in heavy dilution.
Find out about the key risks to this Nebius Group narrative.
Another View: SWS DCF Model On Nebius Group
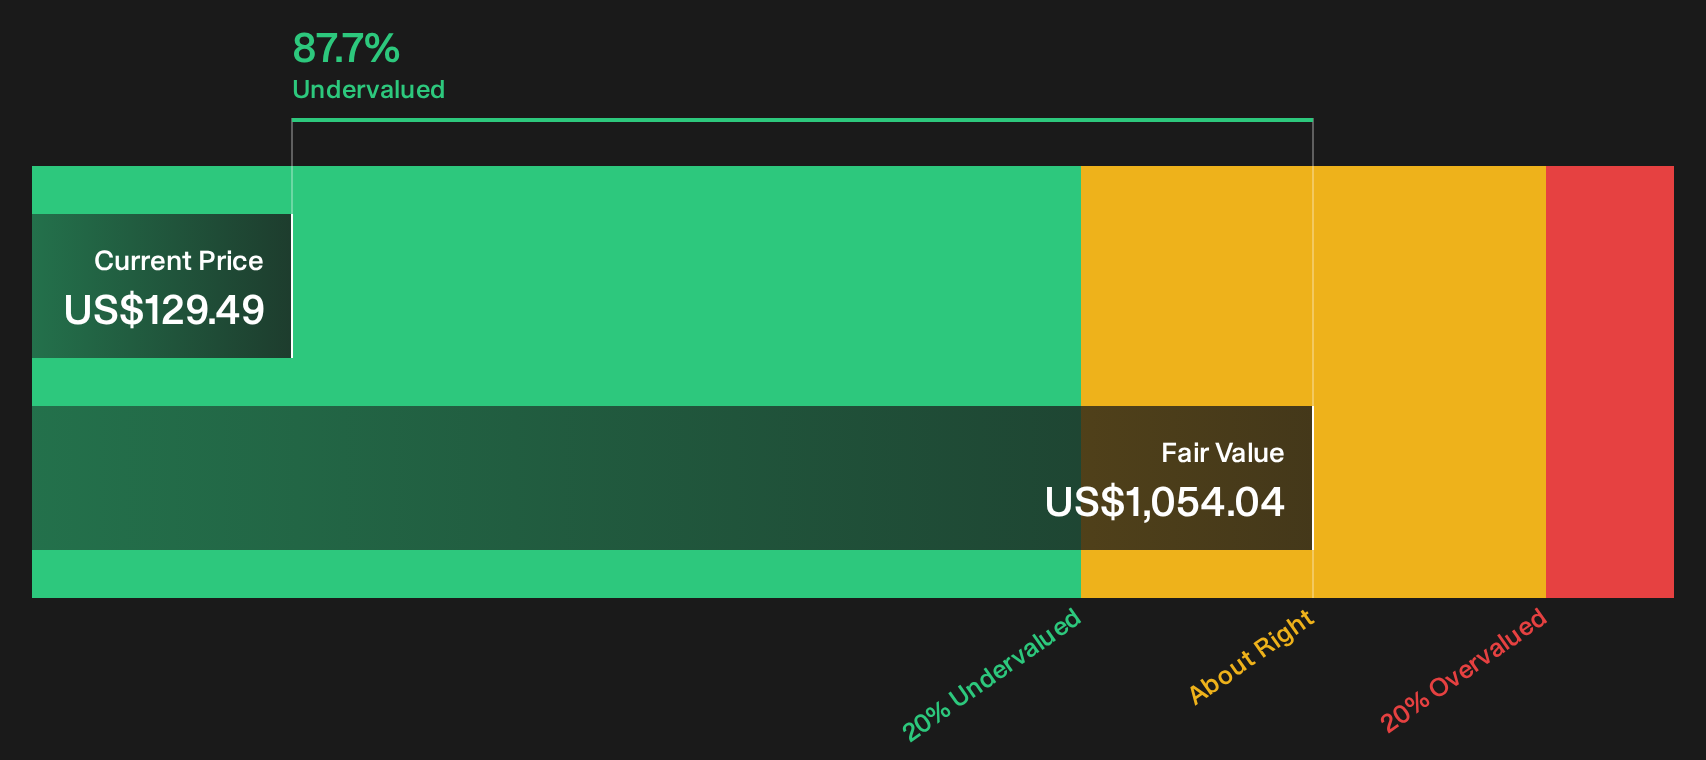
Price based on sales multiples tells one story for Nebius Group. The SWS DCF model tells another. On that framework, NBIS at $129.49 is trading about 87.7% below the modelled future cash flow value of $1,054.04, which flags a very different kind of risk profile. Which lens do you trust more when the gap is this wide?
Look into how the SWS DCF model arrives at its fair value.
Next Steps
Mixed signals around Nebius Group can either paralyse you or prompt closer inspection of the underlying data and narrative. Act while sentiment is still forming by weighing the 2 key rewards and 4 important warning signs.
Looking for more investment ideas beyond Nebius Group?
You have seen how sharply sentiment can shift around Nebius Group. Do not just watch from the sidelines while other opportunities move without you.
- Target potential mispricing by scanning a curated 38 high quality undervalued stocks that focuses on financially solid businesses trading below their assessed worth.
- Lock in income-focused ideas through a focused 7 dividend fortresses built around companies offering higher yields with an eye on sustainability.
- Prioritise resilience by reviewing a 31 resilient stocks with low risk scores that highlights businesses assessed to carry lower overall risk scores.
Have feedback on this article? Concerned about the content? Get in touch with us directly. Alternatively, email editorial-team@simplywallst.com