


The Zhitong Finance App learned that at a time when artificial intelligence (AI) trading is facing major challenges, another liquidity “pumping” test triggered by the issuance of treasury bonds also seems about to have an impact on the entire US stock market.
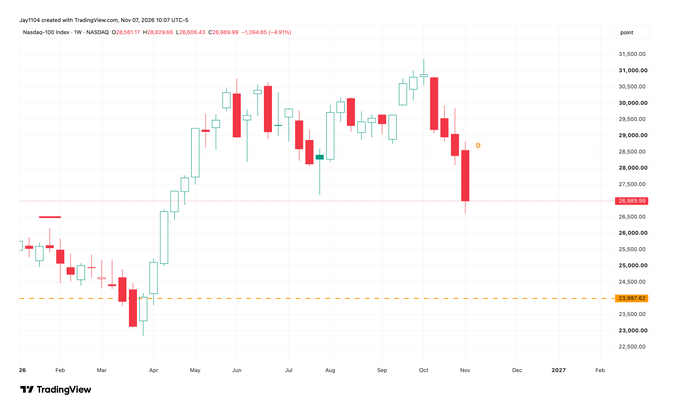
Last week, the S&P 500 index fell about 2.7%, and the Nasdaq 100 index fell even deeper, reaching 4.9%. Both indices have closed down for four consecutive weeks. And this week is coming up, I'm afraid it will be difficult for the market to take a breather — the US Treasury is hoarding cash ahead of schedule through the issuance of short-term treasury bonds in advance in order to cope with the debt ceiling that will soon peak in February, and this “pumping” process is simultaneously suppressing the most crowded technology and semiconductor transactions.
According to information, a new round of intensive short-term treasury note (T-bill) issuance will once again remove liquidity from the system. Of these, the planned net issuance scale will reach 34.2 billion US dollars on November 10, and 23 billion US dollars will be withdrawn on November 12, totaling more than 57 billion US dollars in net issuance, which may become a “dark cloud” weighing on the semiconductor sector.
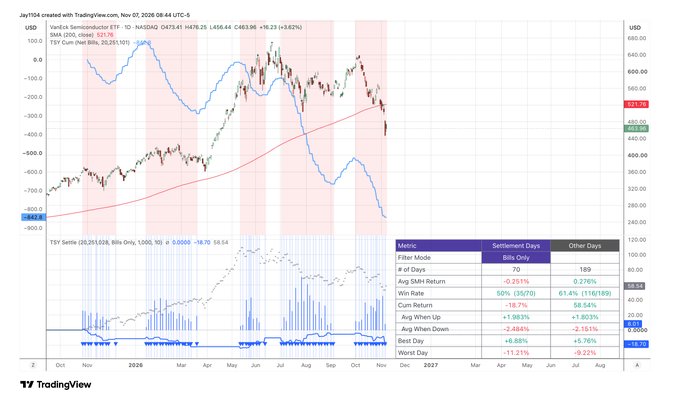
Since net issuance of short-term treasury notes resumed on October 1, the NASDAQ 100 index has accumulated a cumulative decline of more than 10%, and the S&P 500 index has fallen by more than 3%. However, the semiconductor sector suffered the most: the semiconductor index ETF-VanEck (SMH.US) fell by more than 20%, and the technology industry select index ETF-SPDR (XLK.US) also fell by more than 15%. Historical data shows that SMH is often under heavier downward pressure during the intensive issuance of short-term treasury notes, that is, when the amount issued is greater than the amount due and payments, and cash flows out of the system rather than back.
Relevant statistics further confirm this pattern. According to Mott Capital Management, since October 28, 2025, the market has experienced a total of 70 “net issuance days” (the scale of new issuance is greater than payment due) and 189 “non-net issuance transaction days”. On the treasury bill settlement day, SMH rose only 35 times, with an average drop of 25 basis points; on the non-settlement day, SMH recorded 116 gains, with an average increase of nearly 28 basis points.
As far as this week's release calendar is concerned, semiconductor deals can hardly be optimistic. According to Mott Capital Management's analysis, the related fluctuations may continue until the beginning of December — at that time, short-term treasury bill settlement is expected to slow down and shift to a “paydown period” (paydown), that is, the scale of maturity exceeds the scale of new issuance and the cash return system, which will benefit the sector and the entire market. But the real test may be even farther away. According to the US Treasury's latest quarterly financing announcement, it is expected that the Treasury General Account (TGA) balance will rise to 1 trillion US dollars by the end of March 2027, higher than its expected level of 850 billion US dollars on December 31. The Ministry of Finance also announced that it plans to borrow 800 billion US dollars for the January-March quarter, a significant increase from 618 billion US dollars for the October-December quarter.
On the premise that the size of interest-bearing bonds (coupons) remains stable, the Ministry of Finance's presentation to the Borrowing Advisory Committee (TBAC) showed that almost all, or even excess, of the new loans came from short-term treasury bills — note issuance will jump from US$332 billion to US$532 billion, which is more than $100 billion higher than the US$427 billion scale from July to September. This means that the first quarter of 2027 is likely to be the most “tricky” quarter for this sector and the market as a whole.
The deeper concern is that the source of liquidity has quietly changed. Over the past year, as reverse repo (reverse repo) balances have been drastically depleted and close to zero, the excess liquidity that was originally deposited in money market accounts to undertake the issuance of government notes has been exhausted. Today, liquidity appears to be being drawn directly from the market, and considering that there are still a large number of short-term treasury bills to be issued, this pumping process is likely to continue.
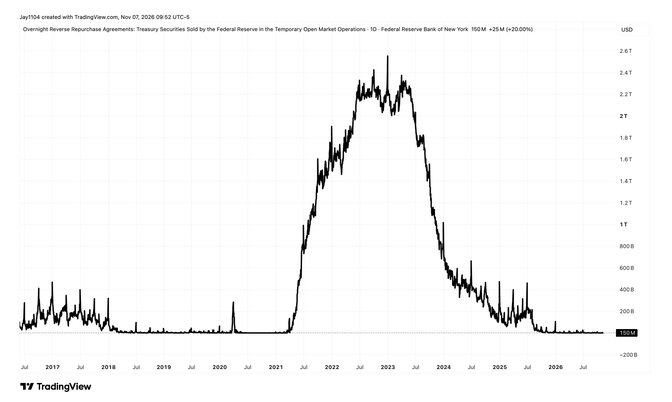
Of course, the situation is not without variables. Mott Capital Management pointed out that if the Federal Reserve restarts its reserve management plan and buys short-term treasury notes again outside of normal operations (as it did last year), the impact on the market may change. However, as far as the present is concerned, the marginal impact of intensive note issuance over the past year on the market has been quite significant, and it is worth continuing to pay close attention.
At the same time, however, the rebound momentum of US stocks themselves also appears weak. Mott Capital Management said that on Friday, despite the technical conditions for a rebound, the stock market did not recover as scheduled. The market may once again experience a rebound window this Monday — the Volatility Index (VIX) closed at nearly 29 on Friday on the 1st. If the rebound still fails to materialize on Monday, it means “it should not rise” for the second consecutive trading day. This is by no means a positive sign.
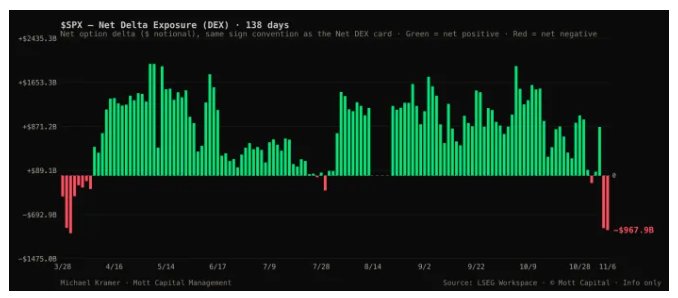
Currently, the S&P 500 index has fallen into the negative gamma range, the put wall (put wall) is at 7,300 points, and even the net delta estimate has turned negative — the last time this happened dates back to the end of March this year. In a negative gamma environment, the hedging behavior of traders will amplify price fluctuations, forming self-strengthening “if you fall, you fall faster, and when you rise, you accelerate up”. Against the backdrop of such high volatility and the short-term volatility expected to fall sharply on Monday morning, if the rebound falls short, it will be a major negative signal for the market.
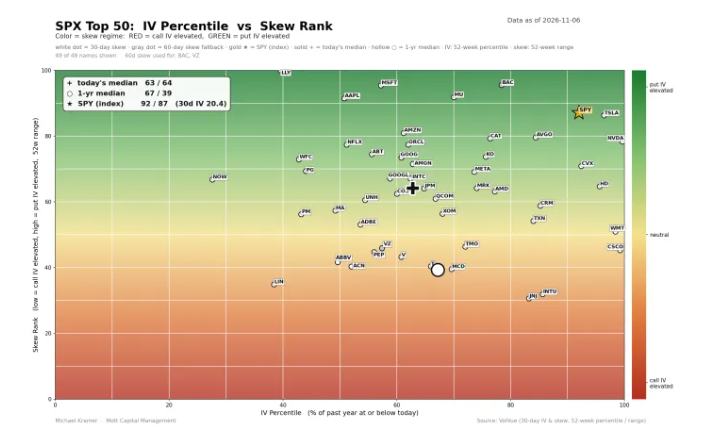
The pessimistic signals released by the options market are also worth wary of. Some analysts pointed out that the current level of bearishness in the options market has “surpassed any moment since spring that I can recall.” The public opinion heatmap tracking the index's top 50 constituent stocks shows that the pattern has changed markedly in just a few weeks, with more individual stocks showing rising bearish bias (put skew) and higher implied volatility.
While the net issuance of short-term treasury notes of more than 57 billion US dollars continues to draw out market liquidity, this week's CPI report is expected to be the biggest variable — if the readings are heated, it may push the Fed's policy to further change hawk, tighten financial conditions, and repeat the logic of 2022. Tighter liquidity combined with tighter financial conditions may be difficult to resist even the most crowded AI trading boom right now.
The debt ceiling peaked in February, and the Ministry of Finance “planned ahead” and rushed into short-term debt
In fact, the source of all of these risks comes from the approach of the US debt ceiling. Wall Street strategists are preparing for the Treasury to hit the borrowing cap as early as February next year, which will trigger so-called “extraordinary measures” before a financing crisis occurs in late 2027. Agencies such as Bank of America, Barclays, and Morgan Stanley point out that the Treasury Department's latest financing estimate, combined with a higher cash balance, will push the debt ceiling to mid-late February — Bank of America's previous estimate was around May.
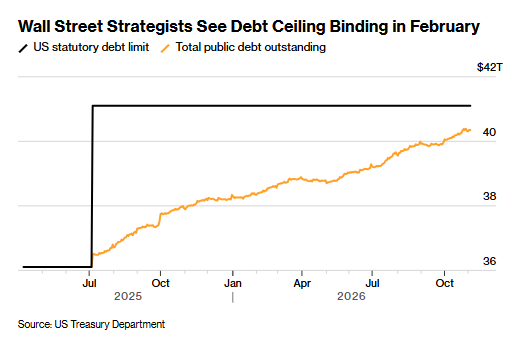
Currently, the US government is less than 800 billion US dollars short of the 41.1 trillion US dollar loan limit. Analysts believe that the Ministry of Finance's increase in its cash balance reflects its increasing reliance on short-term notes to finance government expenses and deficits; since the issuance of notes causes larger and more frequent cash outflows during the month, officials usually need to maintain a thicker buffer, which in turn will consume remaining borrowing capacity more quickly.
Unless Congress agrees to raise or suspend the debt ceiling, the Treasury can avoid default by using unconventional accounting measures, which are expected to provide an additional $300 billion to $350 billion of space.
However, many institutions have given different predictions about the so-called “X Day” — that is, when the Treasury runs out of cash balances and extraordinary measures and is unable to meet all payment obligations: Bank of America believes that in November 2027, there is a risk of “approaching a dangerous zone” in August; Barclays's benchmark situation is from late August to early September, but the timing is highly dependent on September tax points, which are sufficient or can be supported until October; Morgan Stanley expects the Treasury to rebound the incremental auction of interest-bearing bonds until November; SMBC Nikko Securities anticipates a rebound in the Treasury's ability to borrow in April and May After that, maybe Wait until June to use electricity unconventional measures, and cash may run out in September or October.
Debt ceiling restrictions often trigger a ripple effect in the financing market. When the Ministry of Finance begins to use cash balances and reduce the issuance of notes, although it will temporarily increase banking system reserves and put downward pressure on overnight financing interest rates, once the upper limit issue is resolved, the effect will usually be reversed — the Ministry of Finance will increase the issuance of notes again to supplement the “treasury,” thereby drawing out reserves and driving up financing costs.
The protracted stalemate between the two parties in the US may also disrupt parts of the yield curve: in past confrontations, investors would sell treasury bills with maturity close to the “peak” point and instead buy previous or later securities, forming a “kink” (kink) on the curve. As of now, the treasury bill curve shows no signs of concern; after all, it is still a few months away from peaking.
However, the Democratic Party's sweep in the congressional election raised the prospect of it falling into a protracted standoff with US President Trump over fiscal borrowing. Fitch Ratings warned last month that such an outcome would increase the possibility of a “edge game” unless the outgoing Republican-led Congress raised or suspended the debt ceiling before the end of the term.
Barclays strategist Samuel Earl bluntly stated in a report to clients last Friday that “we will be closely monitoring the progress of the settlement process in the coming weeks,” given that the debt ceiling may profoundly shape the currency market next year.