


China Buying Fades as Tech Turbulence Rattles the Complex
Soybeans are ending a rough stretch. As of Nov 6, 2026, January soybeans settled at $11.94 per bushel, up 5.5 cents on the day. Earlier in the week the contract traded at its lowest level in about 11 weeks. As of Nov 4, DTN noted the market was headed for a fourth straight weekly decline, with improved yield prospects and profit taking from near record fund length driving the slide from the late summer highs above $13.00.
China remains the market’s main sensitivity. China has pledged to buy at least 25 million metric tons of US soybeans per year through 2028, and USDA confirmed another private sale of 136,000 metric tons to China this week. However, the market has been selling the fact. Weekly export sales for the week ended Oct 29 totaled 1.456 million metric tons, a three-week low, although still 16.63% above the same week last year. As of Nov 6, China’s Commerce Ministry said further purchases of US farm goods depend on both sides implementing the $60 billion reciprocal tariff cut package, and USTR said Ambassador Greer urged Beijing to meet its agriculture and rare earth commitments ahead of planned Trump and Xi meetings.
Risk off flows have also mattered. The Nasdaq posted its largest one day drop since Jun 5 on Oct 30 after Intel and Amazon results fed AI spending worries, and equities sold off again on Nov 5, which Pro Farmer said limited buying across the grains. In the soy complex, December soybean oil fell to a multi month low on Nov 5, while spreaders bought meal and sold oil.
Supply news is mixed. As of Nov 4, Rabobank forecast Brazil’s 2026/27 soybean crop at 178 million metric tons, down 4 million tons from last season, though planting is running ahead of last year’s pace. Looking ahead, Brazilian planting progress, South American weather and the pace of Chinese purchases are likely to shape sentiment over the coming weeks, while the USDA report on Nov 10 offers a near term update on final US production.
What Has the Market Done?
- From Feb to Aug, the market was generally in a sideways consolidation range between 1235 and 1145.
- After a liquidity check below 1145 (range low) in Jun, buyers were able to step up bids to 1175 (Daily level 2) and use it as a base to break out of the consolidation range at the end of Aug.
- Subsequently, the market rallied up to the 1335 area in Sep.
- However, the market attempted to accept higher with buyers holding bids at the 1300 area (Daily level 1) but failed to do so, resulting in a gradual liquidation of longs in Oct, as seen by the block step move down.
- Then, the market made one last attempt to hold at 1275 area (Minor level 2), above consolidation range 1, but failed.
- This resulted in a more aggressive selloff and a sweep back down into the consolidation range as more longs liquidated.
- As a result, price moved down to yearly VWAP at 1193, which is right around where January futures settled as of Nov 6, 2026.
What to Expect in the Coming Weeks?
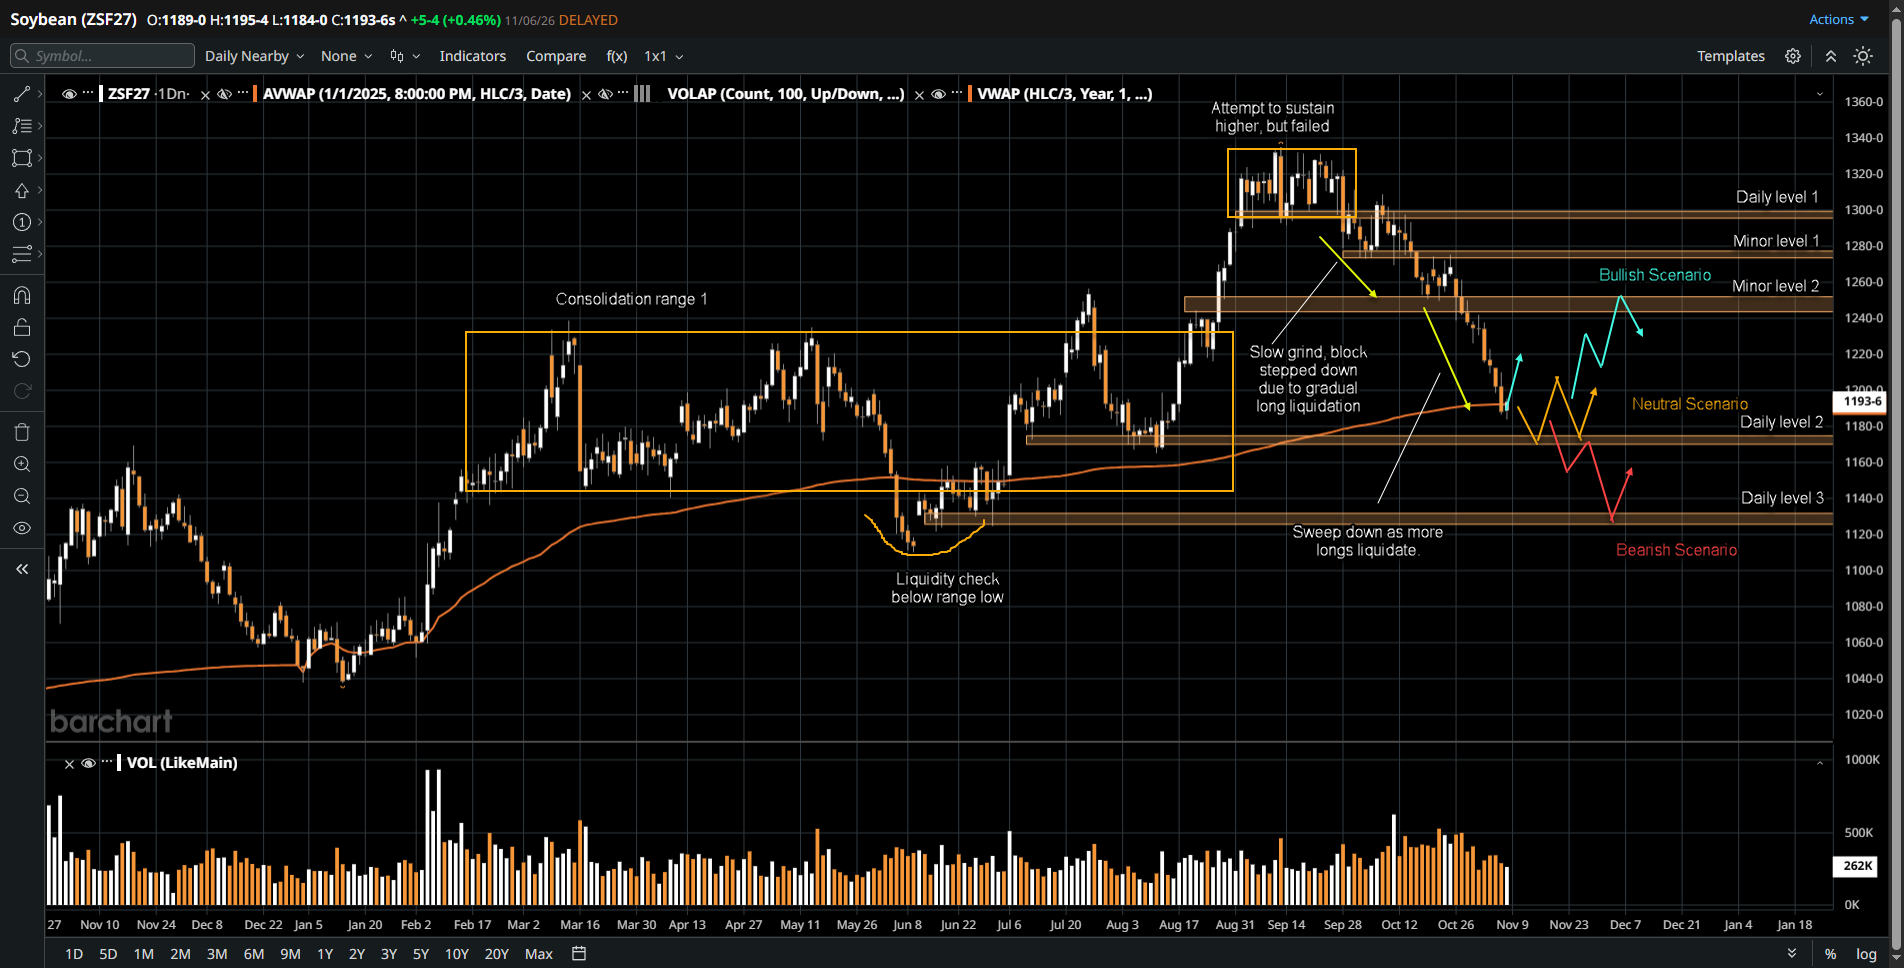
The key levels to watch are 1200 (vicinity of R-VWAP) and 1117-5 (Daily level 2). The scenarios below are framed for the next few weeks to a month.
Neutral Scenario
- Expect the market to possibly auction two-way between 1200 and 1117-5, around yearly VWAP, as the market re-establishes value after a down move.
- A possible supporting condition for this scenario is steady but unspectacular Chinese buying that continues to offset equity market volatility, while the US and China tariff cut talks remain unresolved through the coming weeks.
Bullish Scenario
- If buyers are able to strongly reject up from yearly VWAP or start to step up bids at 1200 after a test of the 1117-5 area, expect a possible move up through consolidation range 1, back to the 1275 area (Minor level 2).
- A possible trigger is a Trump and Xi meeting that finalizes the $60 billion reciprocal tariff cut package, prompting renewed and larger Chinese purchases of US soybeans.
Bearish Scenario
- If buyers fail to hold bids at 1117-5, expect a possible move down to 1130 (Daily level 3), which is also the low of consolidation range 1. Expect buyers to respond here.
- A possible trigger is renewed risk-off selling in equities alongside further slowing of Chinese buying, with a faster Brazilian planting pace and favorable South American weather adding supply pressure over the coming weeks.
Conclusion
Technically, soybeans have returned to value around yearly VWAP after the failed attempt to accept above 1300, so 1200 and 1117-5 define the near-term decision zone. Fundamentally, Chinese purchase headlines, progress on the US and China tariff cut talks, equity market risk appetite and South American crop progress are the main sensitivities to monitor. Will buyers defend yearly VWAP, or will the auction rotate lower toward 1130?
We are the technical partner for traders who understand that edge is built, not bought. EdgeClear provides the execution infrastructure, real-time analytics, and data integrity needed to measure every variable in your trading process. Stop estimating your performance. Open an Account and start quantifying it.
Disclaimer:
This article is provided for informational and educational purposes only and does not constitute financial, investment, or trading advice. The analysis presented reflects the author’s market observations and opinions at the time of writing and is not a recommendation to buy or sell any futures contract, security, or financial instrument. Futures trading involves significant risk and is not suitable for all market participants. Losses may exceed initial margin deposits, and market conditions can change rapidly.
Any scenarios, levels, or market expectations discussed are hypothetical in nature and are intended solely to illustrate potential market behavior. They do not represent actual trading results and should not be interpreted as guarantees of future performance. Past performance, market behavior, or historical price action are not indicative of future outcomes.
Readers are solely responsible for their own trading decisions and risk management. Always conduct independent research, consider your financial situation and risk tolerance, and consult with a qualified financial professional, if necessary, before engaging in futures or derivatives trading.