


Tradeweb Markets (TW) just posted October 2026 operating figures that put its trading engine in focus, with $78.9t in monthly volume and average daily activity of $3.6t, up 26.3% year-over-year.
Recent trading data appears to be feeding into the share price, with Tradeweb Markets posting a 14.99% 1 month share price return and a 22.32% 3 month share price return, while the 1 year total shareholder return of 17.22% points to momentum that has been building rather than fading.
Scan other electronic trading platforms that show similar momentum to Tradeweb Markets with our curated 19 high quality undiscovered gems for ideas beyond the headline grabbers.
Tradeweb Markets is clearly running a powerful electronic franchise, and the recent rally shows investors have noticed. The harder question now is whether that quality is already fully reflected in the price.
Most Popular Narrative: 3% Undervalued
Tradeweb Markets closed at $127.73 against an analyst consensus fair value of $131.53, and the analyst consensus Narrative on Simply Wall St frames that small gap through the lens of electronic trading gains, margin assumptions and a specific discount rate of 7.86%.
Further electronification of global interest rate swaps and U.S. credit, with only about 30% of the global swaps market currently electronic and Tradeweb Markets gaining share in core risk trading and scaling credit volumes across RFQ, blocks, portfolio trading and all-to-all, can support revenue expansion and operating leverage.
See why 13 investors see Tradeweb Markets as 3% undervalued.
Result: Fair Value of $131.53 (UNDERVALUED)
Still, recent revenue falling short of investor forecasts and fast rising technology costs mean Tradeweb Markets faces execution risk if expense growth outpaces client adoption.
Find out about the key risks to this Tradeweb Markets narrative.
Another View: Tradeweb Markets On Earnings Multiples
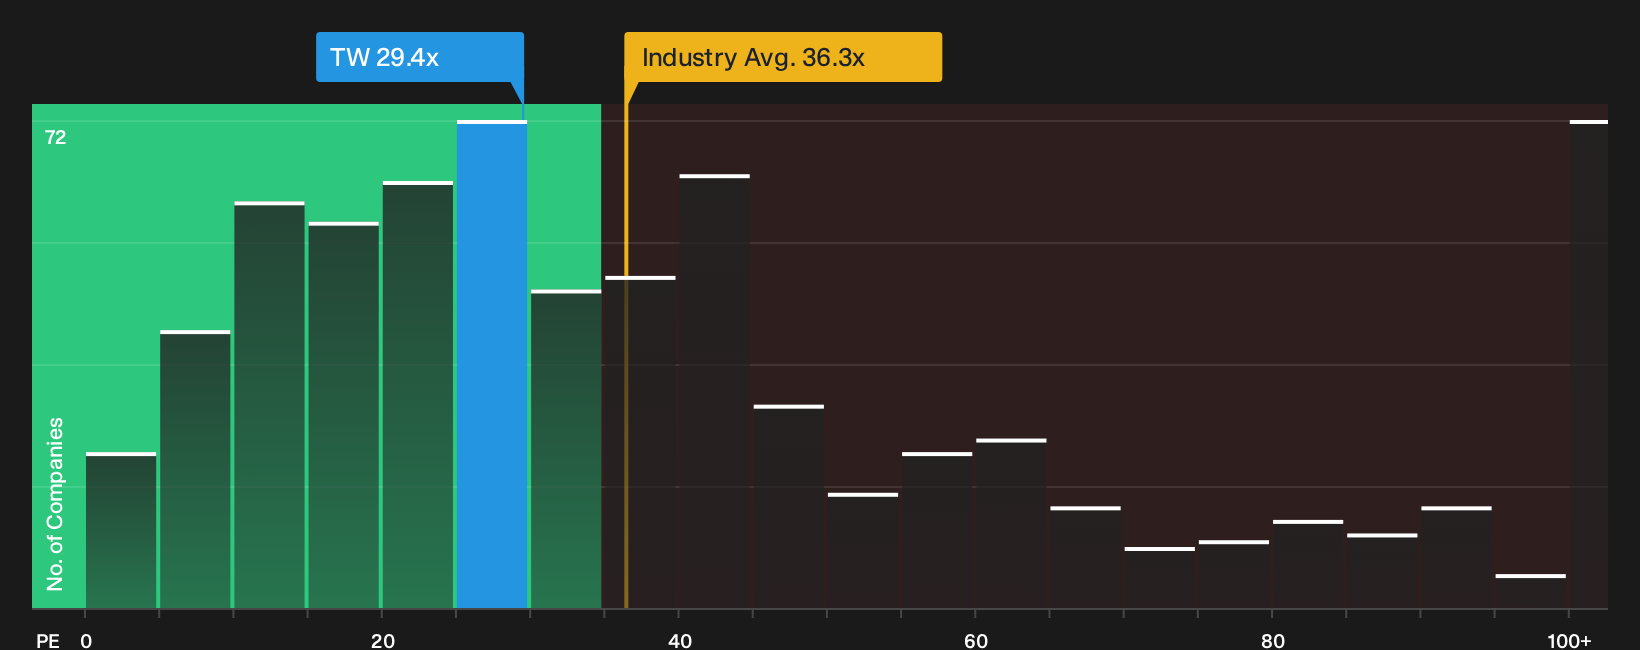
The first narrative presents Tradeweb Markets as modestly undervalued at a fair value estimate of $131.53. A straightforward P/E check suggests a tougher interpretation. The stock trades at 29.4x earnings, above a fair ratio of 15.3x and above a peer average of 27.1x, while remaining below the broader US Capital Markets group at 36.3x. The gap between the current P/E and the lower fair ratio suggests there may be less margin for error if growth or margins differ from expectations. This raises a simple question for investors: is this quality platform worth paying a premium for relative to both its own fair ratio and its closer peers?
To see what the numbers indicate about this price, review our valuation breakdown with See what the numbers say about this price — find out in our valuation breakdown.
Next Steps
Feeling pulled between the bullish narrative and the rich P/E tag on Tradeweb Markets today? Check the full picture for yourself with 3 key rewards.
Looking for more investment ideas beyond Tradeweb Markets?
If Tradeweb Markets has sharpened your focus, do not stop here. Broaden your watchlist now before the next wave of opportunities moves without you.
- Target resilient balance sheets and steady fundamentals by scanning our list of solid balance sheet and fundamentals (25 results).
- Hunt for quality at a discount by tracking companies in the 40 high quality undervalued stocks.
- Prioritise stability and income potential by reviewing the 7 dividend fortresses.
Have feedback on this article? Concerned about the content? Get in touch with us directly. Alternatively, email editorial-team@simplywallst.com