


Chubu Electric Power Company (TSE:9502) cut its full year outlook, now guiding for a loss attributable to owners of ¥215b, alongside a reported half year net loss of ¥280.5b to September 2026.
The revised loss guidance and half year result landed against a weak tape for Chubu Electric Power Company, with the 30 day share price return down 10.79% and the 90 day share price return down 10.54%. However, the 1 year total shareholder return is still 8.37% and the 5 year total shareholder return is 145.46%, pointing to longer term gains but fading short term momentum around the latest headlines.
Spot fresh ideas by comparing Chubu Electric Power Company with a curated 42 power grid technology and infrastructure stocks that could benefit from similar electricity demand and grid investment themes.Chubu Electric Power Company now trades below both its own stated value estimate and the average analyst target after guiding to a sizeable loss. Is that discount protection or a warning signal as you weigh the valuation next?
Preferred Price-to-Sales of 0.5x: Is it justified?
On simple sales based metrics, Chubu Electric Power Company screens as mixed value. The stock trades on a P/S ratio of 0.5x, which sits below the estimated fair P/S level of 0.6x yet above the immediate peer group average of 0.4x.
P/S compares the share price to revenue per share. For a utility like Chubu Electric Power Company, where earnings can swing with fuel costs and regulation, investors often lean on this measure to smooth near term profit volatility and focus on the scale of the underlying operation.
The current multiple suggests the market is paying less than the SWS fair ratio implies for each ¥ of Chubu Electric Power Company revenue, which points to some valuation cushion. At the same time, the stock is priced richer than direct peers on this metric, which signals investors are accepting a premium relative to local comparables. The fair ratio indicates this could move closer to 0.6x over time.
Explore the SWS fair ratio for Chubu Electric Power Company.
Result: Price-to-sales of 0.5x (ABOUT RIGHT)
Still, the loss attributable to owners of ¥215b and the reported half-year net loss of ¥280.5b keep earnings risk front and center for Chubu Electric Power Company.
Find out about the key risks to this Chubu Electric Power Company narrative.
Another view on Chubu Electric Power Company: DCF points a different way
A second lens tells a different story. Our DCF model estimates Chubu Electric Power Company future cash flow value at ¥2,157.3 per share, while the stock trades at ¥2,380.5. That suggests the shares are priced above this fair value mark. If revenue is forecast to decline and earnings only turn positive later, how comfortable are you paying that premium?
Look into how the SWS DCF model arrives at its fair value.
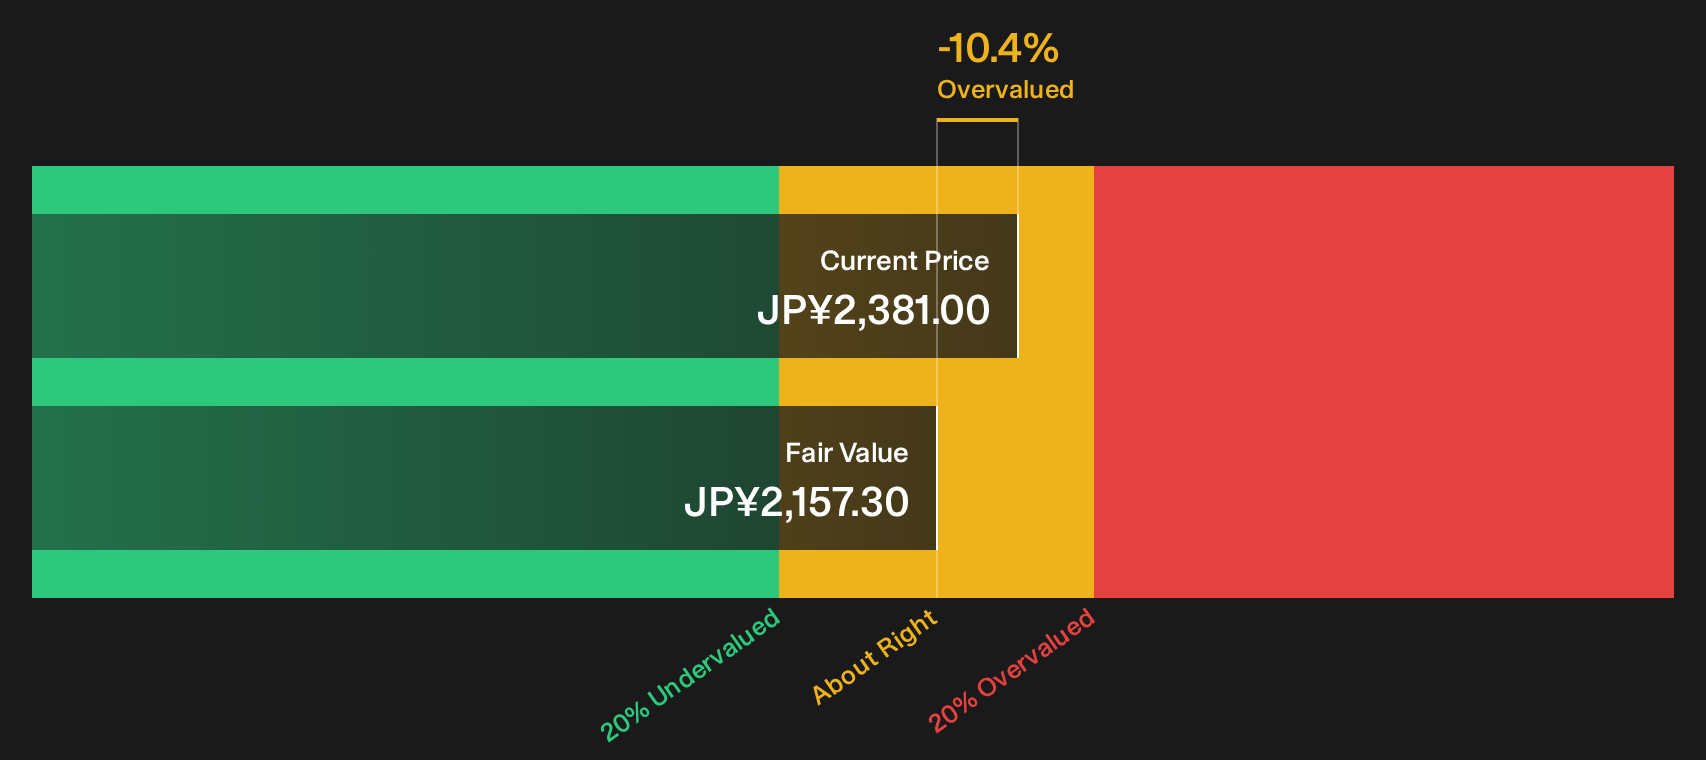
Simply Wall St performs a discounted cash flow (DCF) on every stock in the world every day (check out Chubu Electric Power Company for example). We show the entire calculation in full. You can track the result in your watchlist or portfolio and be alerted when this changes, or use our stock screener to discover 22 high quality undervalued stocks. If you save a screener we even alert you when new companies match - so you never miss a potential opportunity.
Next Steps
Mixed signals around Chubu Electric Power Company can feel messy, which is exactly why it helps to check the data directly and move quickly while headlines are fresh. To balance the concerns against the potential upside, walk through the 2 key rewards and 2 important warning signs
Looking for more investment ideas beyond Chubu Electric Power Company?
Do not stop at just one stock. Fresh ideas often appear where few investors are looking, and delaying that search can mean missing tomorrow's opportunities.
- Scan for quality at a discount by using the 22 high quality undervalued stocks to focus on companies where fundamentals and pricing may be out of sync.
- Target resilient balance sheets through the list of solid balance sheet and fundamentals (23 results) and filter for businesses with financial structures that can better handle shocks.
- Hunt for underfollowed opportunities with the 76 high quality undiscovered gems and see which stocks with strong fundamentals sit off most investors' radar.
Have feedback on this article? Concerned about the content? Get in touch with us directly. Alternatively, email editorial-team@simplywallst.com