


Sanwa Holdings (TSE:5929) has packed a lot into one announcement cycle, combining a new share repurchase plan, higher dividends, and a cut to earnings guidance that puts overseas pressures in sharp focus.
Over the past few months, Sanwa Holdings has seen firmer momentum, with a 30 day share price return of 11.94% and a 90 day gain of 6.64%. However, the year to date share price is still down 5.38%. That mix of buybacks, richer dividends and lower guidance helps explain why investors are recalibrating both growth expectations and risk. At the same time, the 1 year total shareholder return of 1.08% and very large 5 year total shareholder return of roughly 2.4x suggest patient holders have already seen meaningful value from the stock.
Scan for other companies pairing active capital return with cautious outlooks by reviewing our curated 22 high quality undervalued stocks that share some of Sanwa Holdings's current risk reward profile.
Bulls point to richer dividends, buybacks and long term returns, while bears focus on softer earnings guidance and overseas pressure. Which story does Sanwa Holdings's current valuation actually reflect next?
Preferred P/E of 14.6x: Is it justified?
Sanwa Holdings trades on a P/E ratio of 14.6x, and that price tag sits alongside an internal estimate that the shares are trading below their future cash flow value.
The P/E multiple compares the current share price to earnings per share, so it shows how much investors are paying for each unit of profit. For an industrial group with established operations across Japan, North America, Europe, and Asia, this type of earnings based yardstick is a common way to benchmark what the market is willing to pay.
Sanwa Holdings is flagged as good value on this 14.6x P/E when lined up against an estimated fair P/E of 14.9x. This points to only a small gap between the current market pricing and that fair ratio level that the share price could move towards over time.
Yet compared with the JP Building industry average P/E of 11.4x, the stock trades on a much richer multiple, which signals that investors are assigning a higher price to its earnings than to those of the wider peer group.
Explore the SWS fair ratio for Sanwa Holdings.
Result: Price-to-earnings of 14.6x (ABOUT RIGHT)
Still, softer earnings guidance and pressure in overseas operations could challenge the idea that Sanwa Holdings deserves even a modest premium to domestic peers.
Find out about the key risks to this Sanwa Holdings narrative.
Another view on Sanwa Holdings' value
The P/E story hints at Sanwa Holdings trading around fair value, yet our DCF model paints a different picture. At ¥3,901, the shares sit roughly 19% below an estimated future cash flow value of about ¥4,820. That gap looks meaningful. Or is the model being too generous about long term cash generation?
For a closer look at the cash flow inputs that sit behind that gap, and to pressure test the assumptions yourself, Look into how the SWS DCF model arrives at its fair value.
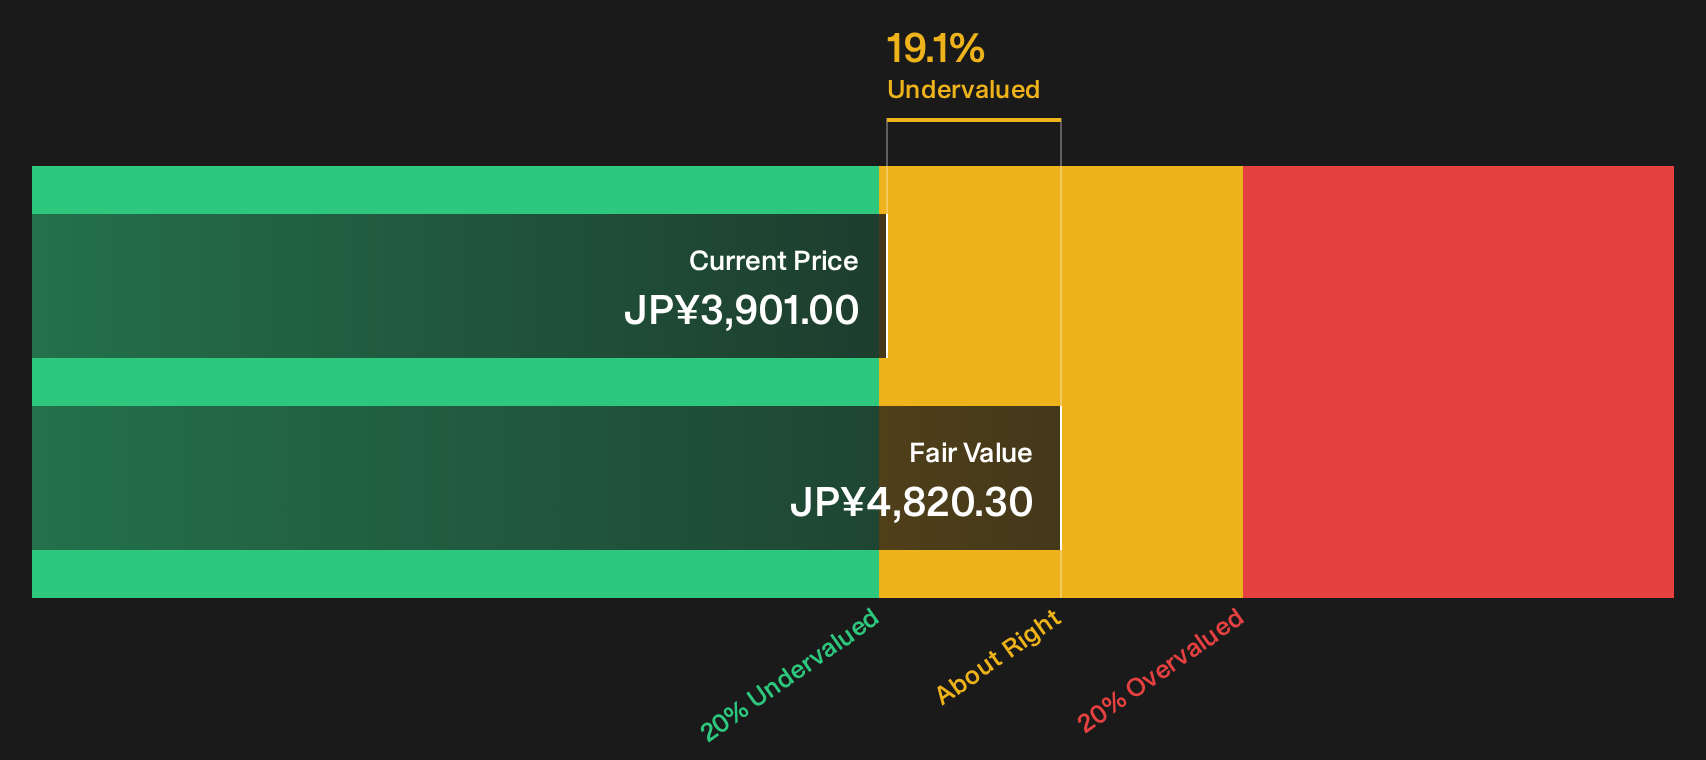
Simply Wall St performs a discounted cash flow (DCF) on every stock in the world every day (check out Sanwa Holdings for example). We show the entire calculation in full. You can track the result in your watchlist or portfolio and be alerted when this changes, or use our stock screener to discover 22 high quality undervalued stocks. If you save a screener we even alert you when new companies match - so you never miss a potential opportunity.
Next Steps
Curious whether the mixed tone around Sanwa Holdings matches your own view of the situation today? Act quickly, review the underlying data, and then weigh those potential bright spots for yourself with the help of our 3 key rewards.
Looking for more ideas beyond Sanwa Holdings?
If Sanwa Holdings has sharpened your focus on price, quality, and risk, do not stop there. Put that momentum to work by widening your opportunity set.
- Chase underappreciated potential and hunt for stocks where fundamentals and price still look out of sync with the help of 22 high quality undervalued stocks.
- Build resilience into your portfolio and focus on companies with stronger finances and cleaner balance sheets by reviewing our list of solid balance sheet and fundamentals (23 results).
- Spot future favourites early and scan through high quality businesses that fewer investors are watching using the 76 high quality undiscovered gems.
Have feedback on this article? Concerned about the content? Get in touch with us directly. Alternatively, email editorial-team@simplywallst.com