


Advanced Micro Devices stock (AMD) jumped 13.26% on Monday to close at $508.58.
The rally followed an Oppenheimer upgrade to Outperform with a $600 price target.
AMD also announced that its fifth-generation EPYC CPUs power Google Cloud's new TPU 8tx systems.
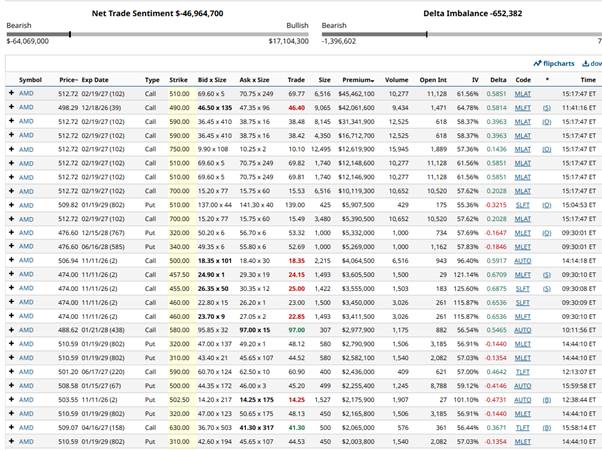
Yet the options flow told a very different story. Barchart's flow data showed a heavy bearish tilt despite the double-digit gain.
Let's break down the unusual options flow and what it might signal for AMD.
Options Volume and Flow Analysis
Monday's options activity in AMD was anything but typical.
Net trade sentiment came in at -$46.96 million. That was $64.07M in bearish flow versus $17.10M in bullish flow.
That's a bearish bias of almost 4:1. Delta imbalance was also negative at -652,382.
But the details matter. One trade did most of the heavy lifting:
- $490 Call (December 18th, 39 DTE): 9,065 contracts sold at $46.40, $42.06M premium, delta 0.5814.
That trade filled below the bid, a strong sign it was sold. Volume of 9,434 versus open interest of 1,471 suggests a new position.
This one block made up about 66% of the day's bearish premium. It also accounts for roughly 527,000 deltas, or about 81% of the net delta imbalance.
Selling calls can be a bearish bet. But it can also be a covered call written against existing stock.
After a sharp rally, overwriting long stock is a common move. The flow data can't tell us which it was.
Other bearish contributors included:
- $455, $457.50 and $460 Calls (November 11th, 2 DTE): 4,408 contracts sold at or below the bid at the open, $10.57M combined premium.
- $500 Call (November 11th, 2 DTE): 2,215 contracts sold at the bid, $4.06M premium.
- $502.50 Put (November 11th, 2 DTE): 1,527 contracts bought at the ask, $2.18M premium.
The early call sellers sold with AMD near $474. The stock then closed more than $34 higher.
What the Headline Numbers Miss
The biggest premium trades of the day weren't flagged as bullish or bearish.
They were multi-leg trades in the February 2027 expiration, all printed at 3:17 pm ET:
- $510 Call (February 19th 2027, 102 DTE): 9,996 contracts across three prints, $69.76M premium.
- $700 Call (February 19th 2027, 102 DTE): 9,996 contracts across two prints, $15.51M premium.
- $590 Call (February 19th 2027, 102 DTE): 12,495 contracts across two prints, $48.05M premium.
- $750 Call (February 19th 2027, 102 DTE): 12,495 contracts, $12.62M premium.
That's about $146M in premium. It's more than the bullish and bearish totals combined.
So these trades appear to have been left out of the sentiment tally.
The matching sizes point to two call spreads: a $510/$700 spread and a $590/$750 spread.
Volume in the $510 and $700 calls closely matched their existing open interest. That hints an existing position was being closed.
The $590 and $750 calls had little open interest. That suggests a new position was opened.
One plausible read is a bullish roll. A trader may have closed a profitable $510/$700 bull call spread.
They may then have opened a larger $590/$750 bull call spread.
If so, they took roughly $18.8M off the table while keeping upside exposure into February.
The new spread would break even near $618 at expiration.
That's an interpretation, not a certainty. A trader rolling a losing bear call spread higher would leave the same footprint.
Put activity was modest by comparison. The largest trades were long-dated puts in 2028 and 2029:
- $510 Put (January 2029, 802 DTE): 425 contracts at $139.00, $5.91M premium.
- $320 Put (December 2028, 767 DTE): 1,000 contracts at $53.32, $5.33M premium.
- $340 Put (June 2028, 585 DTE): 1,000 contracts at $52.69, $5.27M premium.
These look more like long-term hedges than short-term bearish bets.
Technical Picture
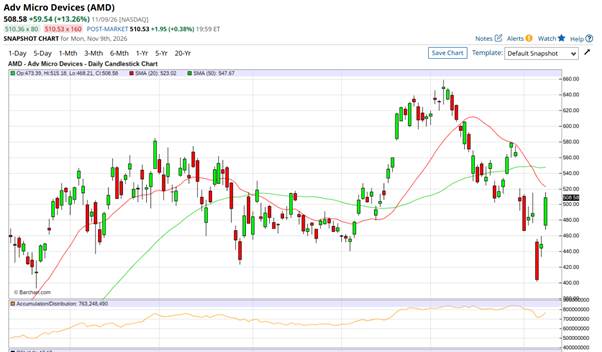
AMD has pulled back sharply from its October high.
The stock set a 52-week closing high of $649.42 in October. Even after Monday's surge, it sits about 22% below that level.
Last week's AI-chip selloff briefly pushed AMD down near $400.
Monday's candle was powerful. AMD opened at $473.39 and closed near the high of the day.
Volume hit about 50.7M shares, roughly 2.2 times the three-month average.
But the trend is still damaged. The stock remains below its 20-day moving average at $523.02.
It is also below the 50-day moving average at $547.67. The 20-day now sits below the 50-day, a bearish signal.
The Accumulation/Distribution line dipped during the selloff. It has started to hook higher but remains below its recent peak.
Near-term resistance sits at the 20-day moving average around $523. The 50-day near $548 is the next hurdle.
Support is at Monday's low of $468, then the $450 area. A break below that could put the $400 low back in play.
Trading Implications
The flow and the chart are sending mixed signals.
The headline sentiment is bearish, but it rests largely on one trade. That trade may be a covered call rather than a directional bet.
The largest premium trades of the day may lean bullish. That read is uncertain, though.
Technically, AMD had a strong reversal day. But it remains below its key moving averages.
Until it reclaims the 20-day and 50-day, the bigger trend still points lower.
Implied volatility is elevated, with February 2027 options priced around 57% to 62%. That makes option premium relatively rich for sellers.
Given this setup, traders may want to stay flexible.
Bears might consider bear call spreads above the 50-day moving average.
Bulls might consider bull put spreads below support at $468.
Neutral traders could combine both into a short iron condor.
All three are defined-risk strategies, so the maximum loss is known upfront.
Company Details
Advanced Micro Devices designs high-performance processors and graphics chips.
Its products include Ryzen PC processors, EPYC server CPUs and Radeon graphics.
AMD's Instinct accelerators compete with Nvidia in the AI data center market. The company also sells adaptive and embedded chips through its Xilinx business.
Oppenheimer upgraded AMD to Outperform on Monday with a $600 price target.
AMD rates as a Strong Buy according to 37 analysts, with 2 Moderate Buy and 8 Hold ratings.
Please remember that options are risky, and investors can lose 100% of their investment.
This article is for education purposes only and not a trade recommendation. Remember to always do your own due diligence and consult your financial advisor before making any investment decisions.
On the date of publication, Gavin McMaster did not directly have a position in any of the securities mentioned in this article. All information and data in this article is solely for informational purposes. For more information please view the Barchart Disclosure Policy here.