


Half year earnings jolt Sankyo stock into focus
Sankyo (TSE:6417) has moved into the spotlight after releasing half year results to 30 September 2026, with both sales and profit lower than in the same period a year earlier.
The share price reaction has been mixed. Sankyo is down about 2.2% on the day of the results but still shows a 10.6% 90 day share price return and a much stronger 3 year total shareholder return of around 98%, suggesting long term holders have seen a very different experience compared with more recent buyers.
Compare Sankyo's recent half year setback with other companies that screen well on cash flows and balance sheets by scanning our hand picked 20 high quality undervalued stocks.
Sankyo now carries a weaker half year profit picture but a powerful multi year share price run. Is most of the easy upside already in the rear view mirror, or do the current valuation markers still argue for further gains?
Price-to-Earnings of 11x: Is it justified?
Sankyo closed at ¥2,141.5, and on that price the shares trade on a P/E of 11x, which screens as inexpensive against both peers and the broader JP Leisure group.
The P/E ratio compares what investors pay for each unit of current earnings. For a business like Sankyo that already earns profits, this measure gives a quick sense of how the market is weighing those earnings against similar listed companies in the same space.
On 11x earnings, the stock is priced well below the JP Leisure industry average of 15.7x and also below the peer group average of 20.2x. That kind of gap indicates the market is assigning a discount to Sankyo's earnings, while the estimated fair P/E of 13.9x sits meaningfully higher than where the shares trade today.
Explore the SWS fair ratio for Sankyo.
Result: Price-to-Earnings of 11x (UNDERVALUED)
Still, the recent half year earnings setback and a year to date share price decline of about 15.6% both challenge the idea that Sankyo’s low P/E tells the whole story.
Find out about the key risks to this Sankyo narrative.
Another view on Sankyo's value
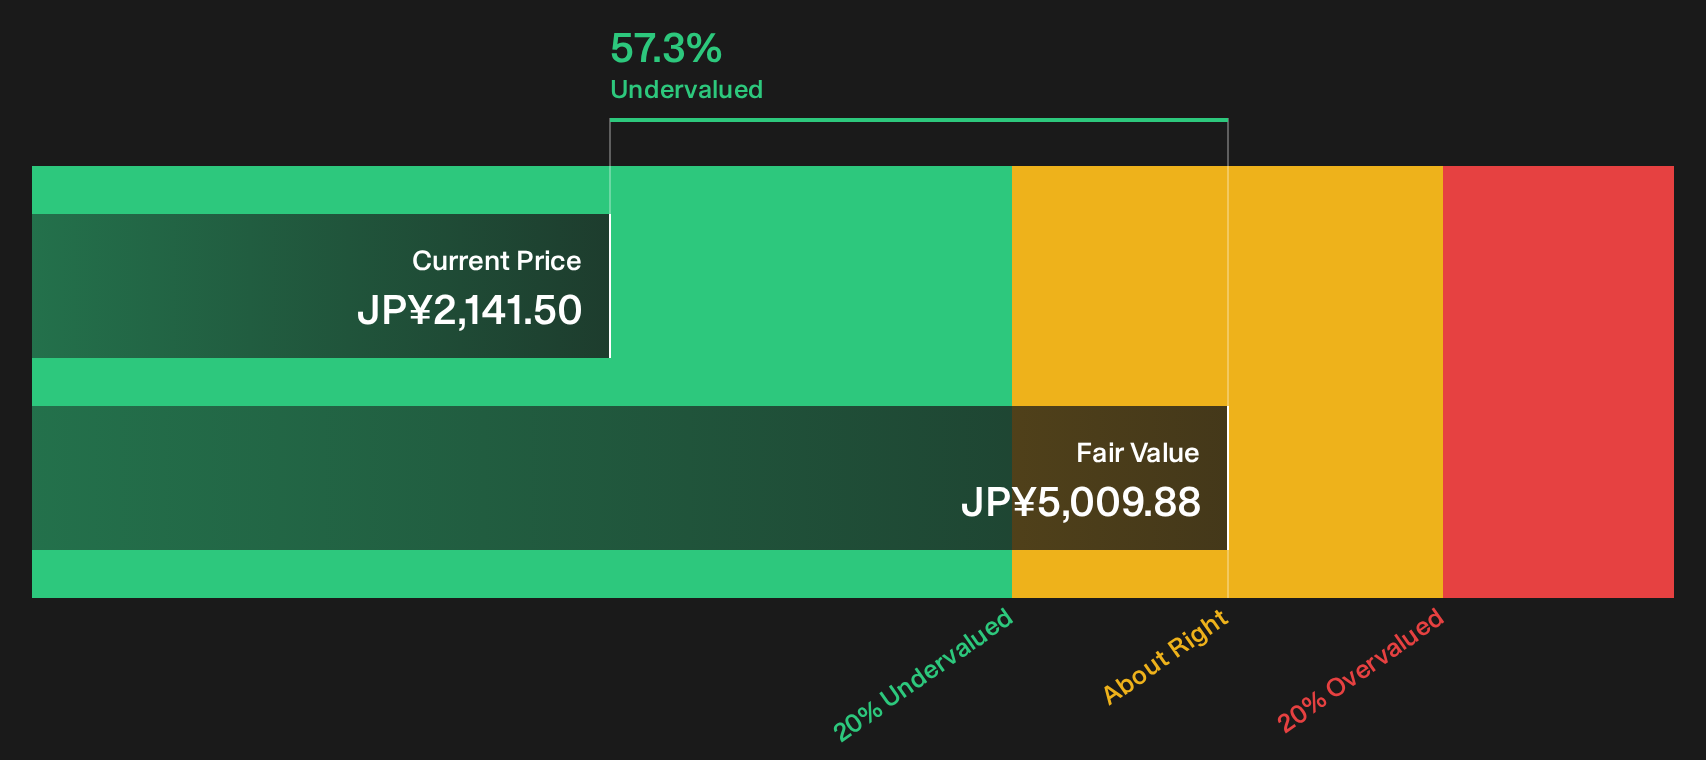
The earlier P/E check paints Sankyo as cheap against local leisure rivals. A different lens gives a far stronger signal. The SWS DCF model estimates future cash flows at roughly ¥5,009.88 per share, which places the current ¥2,141.5 price at about a 57.3% discount.
That kind of gap can hint at opportunity if the cash flow path holds up, or at risk if the inputs prove too optimistic. It raises a simple question for you as an investor: Is this a mispricing that closes over time, or is the model being too generous about Sankyo's future cash generation?
Look into how the SWS DCF model arrives at its fair value.
Simply Wall St performs a discounted cash flow (DCF) on every stock in the world every day (check out Sankyo for example). We show the entire calculation in full. You can track the result in your watchlist or portfolio and be alerted when this changes, or use our stock screener to discover 20 high quality undervalued stocks. If you save a screener we even alert you when new companies match - so you never miss a potential opportunity.
Next Steps
If this mix of cheap-looking valuation and softer recent earnings leaves you on the fence, consider testing the numbers yourself and weighing both sides of the Sankyo story. To see how risks and upsides balance out, start with the 3 key rewards and 1 important warning sign.
Looking for more investment ideas beyond Sankyo?
If Sankyo has sharpened your thinking, do not stop here. The next great opportunity might already be trading, just not on your radar yet.
- Target dependable income streams by scanning companies that resemble dividend fortresses through the 27 dividend fortresses.
- Hunt for resilient balance sheets by reviewing the list of solid balance sheet and fundamentals (23 results) before the crowd catches on.
- Spot potential future leaders early by checking the 76 high quality undiscovered gems while they are still off most investors' screens.
Have feedback on this article? Concerned about the content? Get in touch with us directly. Alternatively, email editorial-team@simplywallst.com