


Chiba Bank (TSE:8331) just packed several shareholder-focused moves into one day, including a fresh buyback plan, higher earnings guidance and a richer dividend outlook tied to stronger interim net interest income.
The latest earnings upgrade, richer dividends and fresh buyback help explain why Chiba Bank’s share price has climbed 45.55% year to date and delivered a 79.40% total shareholder return over 12 months, even though the 90 day share price return is down 5.08% from its recent peak.
Scan beyond Chiba Bank and size up other dividend and income ideas with our hand-picked 27 dividend fortresses that have already cleared a 5% yield hurdle.
Bulls point to Chiba Bank’s upgraded earnings, richer dividends and fresh buyback, while bears flag the sharp run ahead of guidance. Which side does the valuation currently support?
Price-to-Earnings of 17.5x: Is it justified?
On simple P/E terms, Chiba Bank trades on 17.5x earnings, which is richer than many domestic lenders and implies investors are already paying up for its recent momentum.
The P/E ratio compares the current share price to earnings per share, so a higher figure usually means the market is willing to pay more for each unit of profit. For a regional bank like Chiba Bank, that often reflects expectations around loan growth, fee income and credit quality rather than just past results.
Here, the valuation looks full compared to several benchmarks. The stock’s 17.5x P/E is higher than the JP Banks industry average of 12.7x and sits above the peer group on 15.5x. It also exceeds an estimated fair P/E of 16.8x, suggesting investors are currently assigning a premium that could compress if sentiment cools or earnings delivery falls short of expectations.
Explore the SWS fair ratio for Chiba Bank.
Result: Price-to-Earnings of 17.5x (OVERVALUED)
Still, a sharp 45.55% year to date share price gain and a 17.5x P/E leave Chiba Bank exposed if earnings guidance, buybacks or credit quality disappoint.
Find out about the key risks to this Chiba Bank narrative.
Another View: Our DCF Model Paints A Different Picture
While the P/E screen makes Chiba Bank look expensive, the SWS DCF model points in the opposite direction. At ¥2,607.5 the shares trade about 36.3% below an estimated future cash flow value of ¥4,092.62. That gap suggests the market price may not fully reflect the cash the bank is expected to generate. This raises the question of which signal investors should weigh more heavily: the P/E screen or the DCF model.
Look into how the SWS DCF model arrives at its fair value.
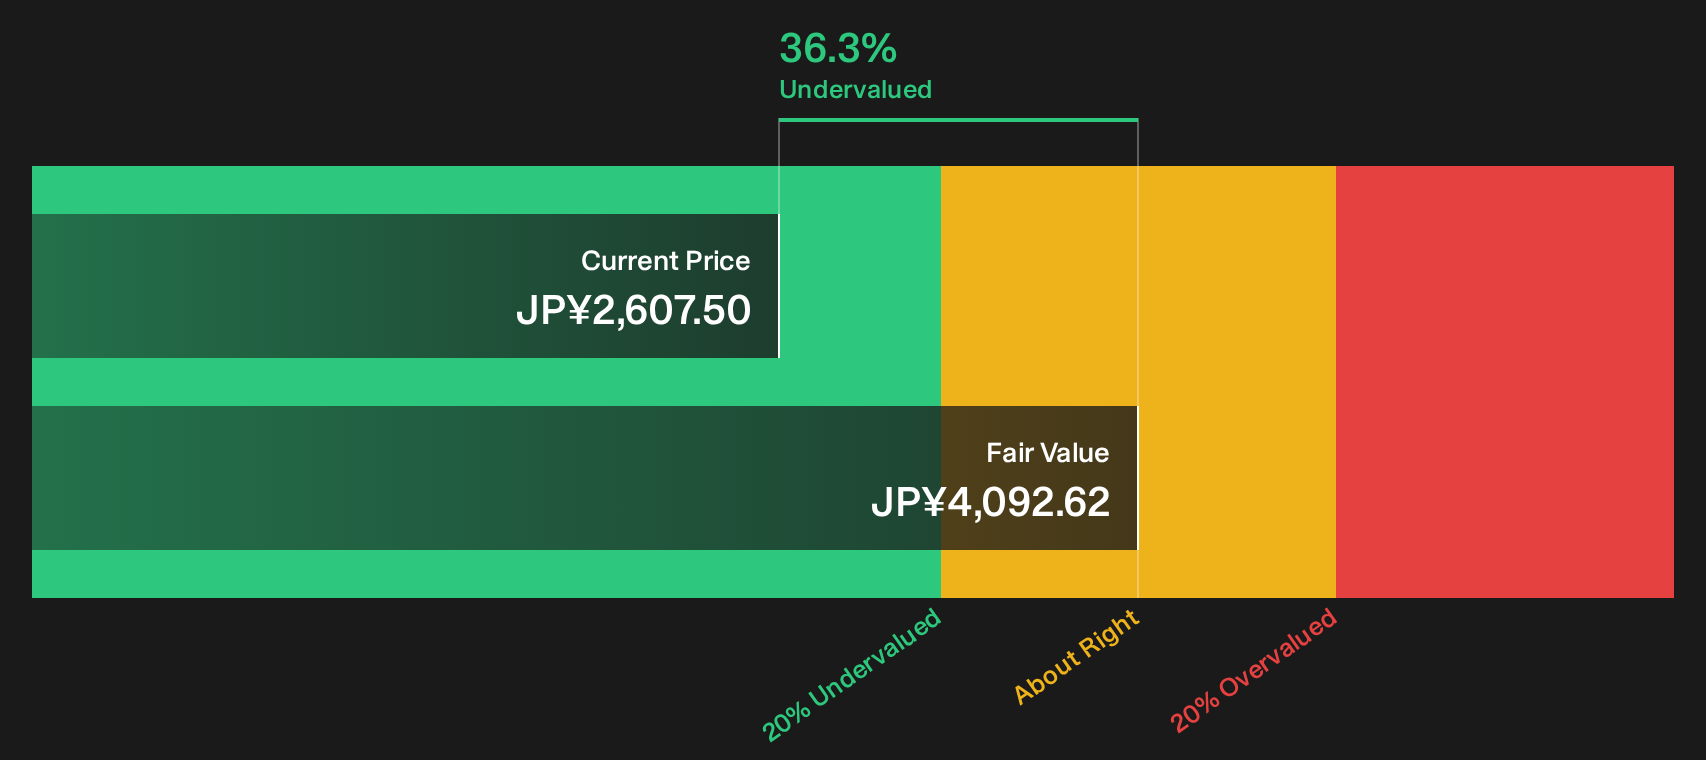
Simply Wall St performs a discounted cash flow (DCF) on every stock in the world every day (check out Chiba Bank for example). We show the entire calculation in full. You can track the result in your watchlist or portfolio and be alerted when this changes, or use our stock screener to discover 20 high quality undervalued stocks. If you save a screener we even alert you when new companies match - so you never miss a potential opportunity.
Next Steps
If this mix of richer guidance and valuation gaps leaves you on the fence, move quickly and review the underlying numbers yourself. Then weigh the 4 key rewards and 2 important warning signs against your own expectations for Chiba Bank.
Looking for more investment ideas beyond Chiba Bank?
Ready to widen your watchlist and sharpen your next move? Put a few minutes into fresh ideas now, or risk watching others seize them first.
- Target strong fundamentals and balance sheet resilience by scanning a curated list of solid balance sheet and fundamentals (23 results) that filters for financial strength before anything else.
- Hunt for mispriced opportunities by reviewing a focused 20 high quality undervalued stocks that combines quality metrics with attractive valuations.
- Prioritize resilience and capital protection by working through a 18 resilient stocks with low risk scores designed to spotlight businesses with lower risk scores.
Have feedback on this article? Concerned about the content? Get in touch with us directly. Alternatively, email editorial-team@simplywallst.com