


Iron Mountain (IRM) just packed several signals into one day, pairing a third quarter earnings release with higher full year revenue guidance and a 15% dividend increase that puts income and growth investors on alert.
The third quarter update snapped investors to attention because it hit a stock that had cooled off in recent months. Iron Mountain’s share price jumped 4.06% on the day to $110.85. However, the 30 day share price return is down 3.20% and the 90 day share price return is down 9.43%. Even with that pullback, momentum over a longer stretch still looks strong, with a year to date share price return of 33.17% and a five year total shareholder return of 173.60% illustrating how the income story and business expansion have already rewarded long term holders.
Scan what investors are pricing into Iron Mountain’s latest move, then compare it with a curated set of income and quality plays in our 6 dividend fortresses for context.
Iron Mountain has just rewarded existing holders with stronger numbers and a richer dividend, while the share price is still below recent highs. Does that set up a reasonable entry today, or does it argue for more patience on price?
Most Popular Narrative: 22% Undervalued
Iron Mountain is priced at $110.85 while the analyst consensus Narrative on Simply Wall St anchors fair value closer to $141. This points to a material gap that hinges on how its newer data center and digital businesses develop.
Robust hyperscale data center demand, including 110 megawatts of leases signed year to date and 325 megawatts of capacity scheduled to energize over the next 18 to 24 months with over 90% of leasing historically to major cloud providers on 10 to 15 year contracts, supports the view that Iron Mountain can grow high visibility recurring revenue and contribute to future AFFO growth.
See why 50 investors see Iron Mountain as 22% undervalued.
Result: Fair Value of $141.36 (UNDERVALUED)
Still, the Iron Mountain story can change quickly if power and equipment delays slow data center projects or if higher leverage tightens funding for growth plans.
Find out about the key risks to this Iron Mountain narrative.
Another View: What Iron Mountain’s P/E Is Telling You
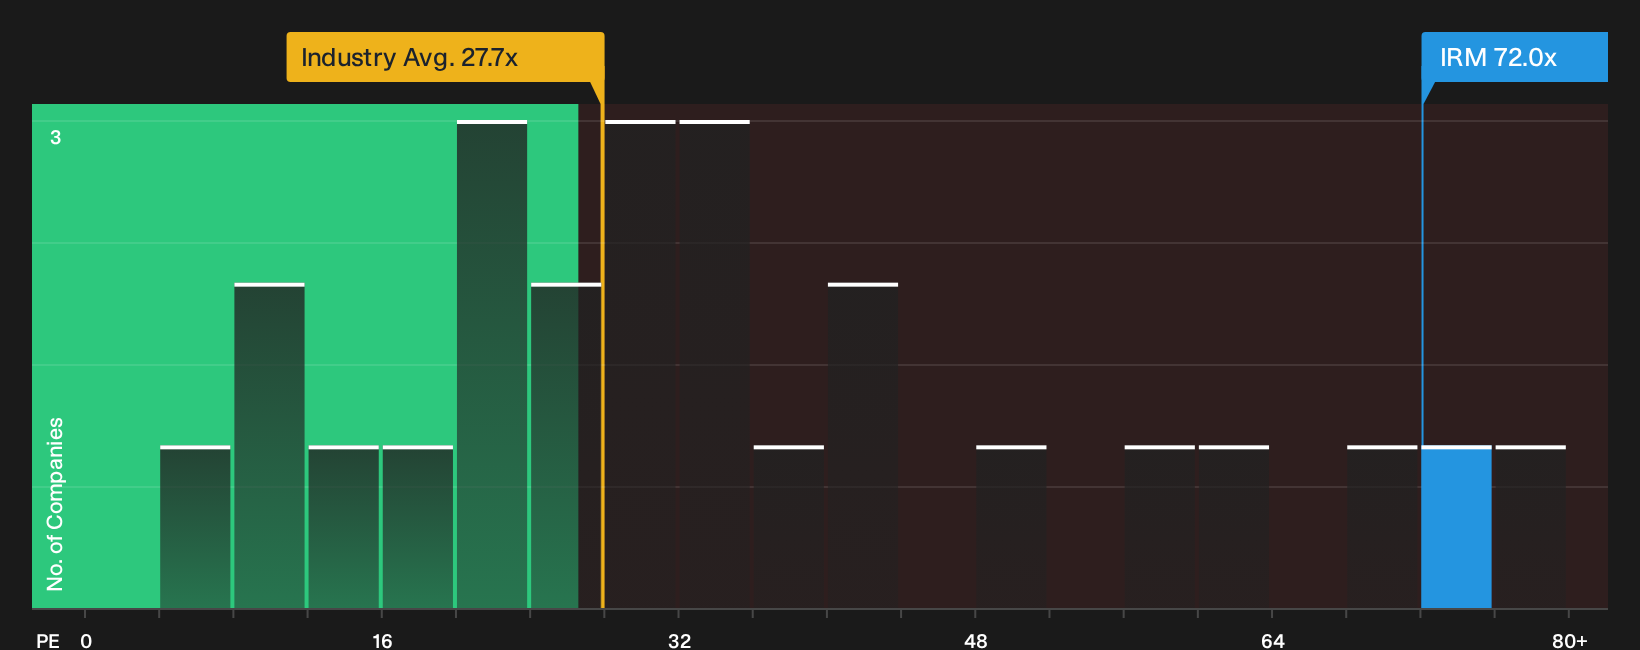
The SWS DCF model points to upside, yet the simple earnings multiple tells a more expensive story. Iron Mountain trades on a 72x P/E, while the fair ratio is 42.2x. The broader North American Specialized REITs group sits at 27.6x and close peers average 18.4x.
That spread suggests investors are already paying a steep premium for Iron Mountain’s growth narrative based on earnings alone. The question for you is whether those future data center and digital cash flows justify paying more than double the peer average multiple.
See what the numbers say about this price — find out in our valuation breakdown.
Next Steps
Plenty in Iron Mountain’s story today points in different directions, and that mix of concern and optimism is exactly why you should run the numbers yourself and stress test your thesis. To weigh both sides clearly, start with the 4 key rewards and 3 important warning signs.
Looking for more Iron Mountain sized ideas?
If Iron Mountain has sharpened your thinking, do not stop here. Broaden your watchlist with a few focused screens that surface different types of opportunities.
- Hunt for quality at a discount by checking companies that screen well on valuation and fundamentals through the 33 high quality undervalued stocks.
- Strengthen your defense by scanning for businesses with resilient finances using the list of solid balance sheet and fundamentals (25 results).
- Stay ahead of the crowd by investigating underfollowed opportunities highlighted in our 19 high quality undiscovered gems.
Have feedback on this article? Concerned about the content? Get in touch with us directly. Alternatively, email editorial-team@simplywallst.com