


Why Gibson Energy’s latest earnings matter for shareholders
Gibson Energy (TSX:GEI) just posted third quarter results that showed higher sales and net income compared with a year ago, and the board reaffirmed a quarterly dividend of CA$0.45 per share.
Recent trading has been choppy for Gibson Energy. The share price slipped 6.21% over the past week but is still up 25.08% year to date, while the 1-year total shareholder return of 43.59% points to momentum that has been building over a longer stretch.
Scan how Gibson Energy’s earnings momentum and dividend profile compare with peers by reviewing the hand-picked 3 dividend fortresses that are built around consistent income and balance-sheet strength.
Bulls point to Gibson Energy’s stronger recent quarter and steady CA$0.45 payout, while bears flag choppy trading and mixed nine month earnings. Which story does the current valuation actually support?
Price-to-Earnings of 27.6x: Is it justified for Gibson Energy?
On earnings, Gibson Energy trades on a P/E of 27.6x, which is meaningfully higher than peers, even though the last close was CA$32.02. That combination points to a rich valuation relative to similar oil and gas stocks.
The P/E ratio compares what investors pay per share with the profit attributed to each share. For a midstream and marketing operator like Gibson Energy, that figure often reflects how much faith the market has in future cash flows rather than just what the last twelve months delivered.
Gibson Energy’s earnings grew 32.5% over the past year and are forecast to rise about 11.8% per year, which helps explain some premium. Even so, the current 27.6x multiple is materially above the estimated Fair P/E of 18.6x. The valuation work suggests the market could eventually move closer to that level if expectations cool.
The gap versus peers is clear. The stock’s 27.6x P/E compares with a 20.2x average for its direct peer set and 17.5x for the broader Canadian oil and gas group. This signals investors are paying up aggressively for Gibson Energy’s earnings relative to sector norms.
Explore the SWS fair ratio for Gibson Energy.
Result: Price-to-Earnings of 27.6x (OVERVALUED)
Still, any pullback in energy prices or weaker results from the larger Marketing segment, which generated CA$13,234.06m in revenue, could challenge Gibson Energy’s premium P/E narrative.
Find out about the key risks to this Gibson Energy narrative.
Another view on Gibson Energy’s value
The rich 27.6x P/E paints Gibson Energy as expensive, yet the SWS DCF model points in the opposite direction. At CA$32.02 the stock is assessed as trading about 60% below an estimated future cash flow value of CA$80.07, which frames today’s price as a potential discount. Which lens do you trust more for the long haul?
Look into how the SWS DCF model arrives at its fair value.
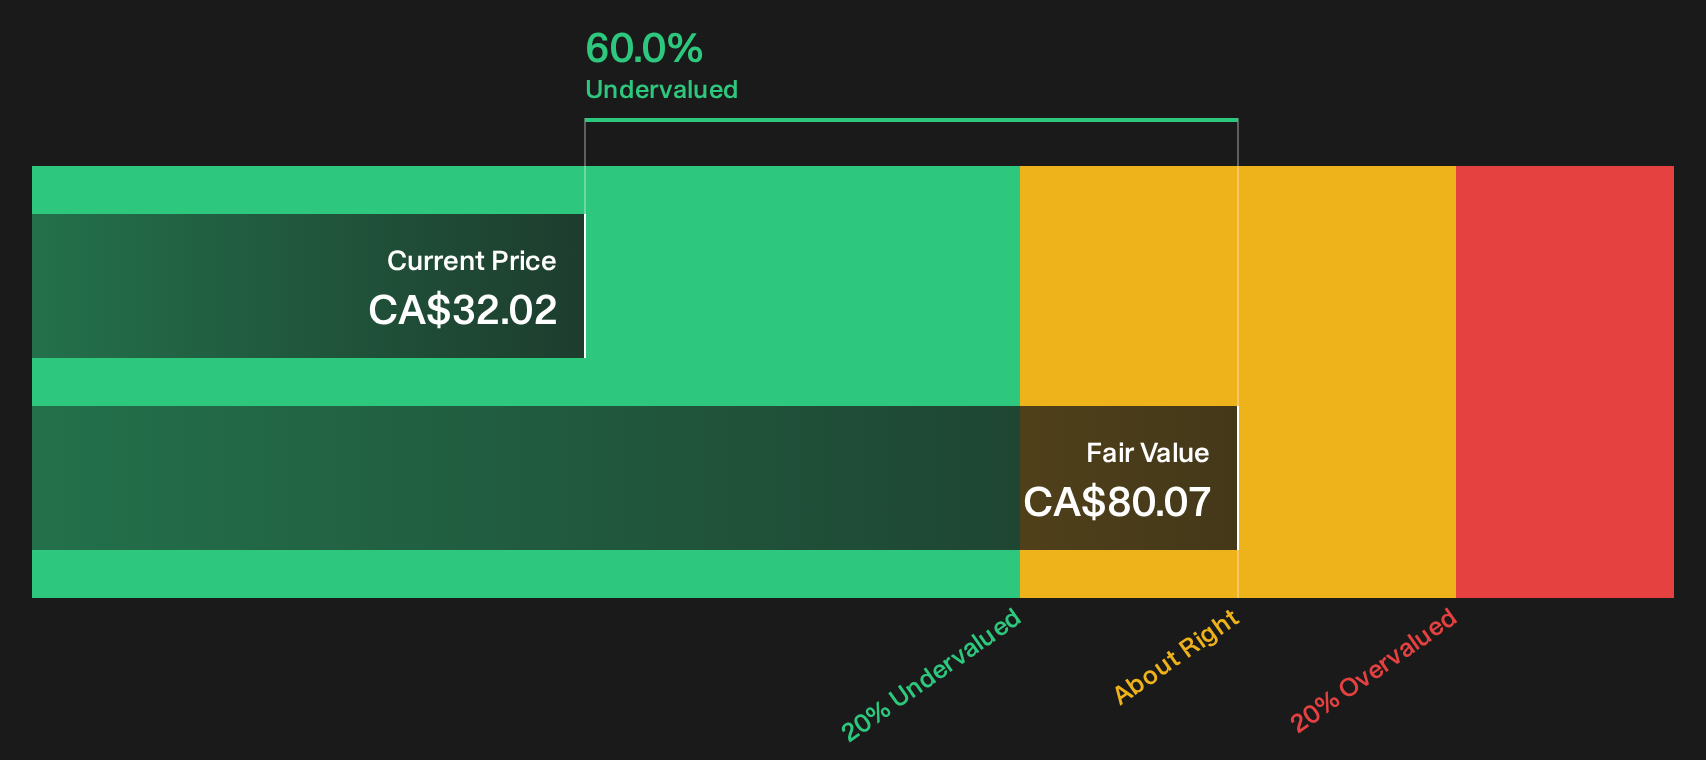
Simply Wall St performs a discounted cash flow (DCF) on every stock in the world every day (check out Gibson Energy for example). We show the entire calculation in full. You can track the result in your watchlist or portfolio and be alerted when this changes, or use our stock screener to discover 5 high quality undervalued stocks. If you save a screener we even alert you when new companies match - so you never miss a potential opportunity.
Next Steps
Mixed signals around Gibson Energy’s valuation and income profile can feel messy. Move quickly, examine the numbers closely, and weigh both sides for yourself using the 3 key rewards and 2 important warning signs
Looking for more investment ideas beyond Gibson Energy?
If Gibson Energy has you thinking harder about price, income, and risk, now is the time to widen your watchlist before the next move passes you by.
- Target steady income and balance sheet strength by reviewing our curated 3 dividend fortresses that focus on reliable payouts backed by robust financial footing.
- Hunt for quality at a discount with the 5 high quality undervalued stocks that spotlight companies where fundamentals and valuation are still out of sync.
- Prioritise capital resilience through the 9 resilient stocks with low risk scores that highlight businesses with sturdier risk profiles and more consistent financial traits.
Have feedback on this article? Concerned about the content? Get in touch with us directly. Alternatively, email editorial-team@simplywallst.com