


Q3 earnings call and dividend set the tone for CNA Financial
CNA Financial (CNA) moved into the spotlight after releasing its pre recorded Q3 2026 earnings call on 2 November and affirming a regular quarterly dividend of US$0.48 per share.
Recent trading has been steady rather than dramatic, with the share price at US$48.16. Short term moves around the earnings release and dividend affirmation have added to an already positive backdrop that includes a 1 year total shareholder return of 13.52% and a 5 year total shareholder return of 55.17%.
Scan beyond CNA Financial and compare this dividend story with a curated 5 dividend fortresses that also pairs income with established track records.
CNA Financial has a long operating history, a diversified commercial insurance footprint and a regular dividend, yet the stock now trades around analyst target and at a sizeable modelled intrinsic discount. Is that gap justified by the valuation math, or not?
Price-to-earnings of 12.7x for CNA Financial: Is it justified?
CNA Financial currently trades on a P/E of 12.7x, with the last close at $48.16 and the stock flagged as trading at a sizeable discount to an estimated future cash flow value of $85.21. That mix of a moderate earnings multiple and a 43.5% modelled intrinsic discount creates a valuation picture that is not straightforward on headline numbers alone.
The P/E ratio simply takes the share price and compares it to the past year's earnings per share. For an insurer like CNA Financial, this measure is often used as a quick shorthand for how the market prices current profits from underwriting and investment income, relative to peers facing similar regulatory and capital requirements.
On the one hand, CNA is described as good value on a P/E basis against a peer average of 16x and against an estimated Fair P/E Ratio of 13.6x. This points to some room for the multiple to move higher if the market aligns with that fair value estimate. On the other hand, the stock is described as expensive when compared with the broader US Insurance industry average P/E of 11.6x. This suggests investors are already paying a premium versus the sector even as the SWS DCF model indicates the share price sits 43.5% below its estimated future cash flow value.
Explore the SWS fair ratio for CNA Financial.
Result: Price-to-earnings of 12.7x (UNDERVALUED)
Still, the valuation story for CNA Financial could be disrupted if insurance claims trends shift unexpectedly or if investment results soften relative to current expectations.
Find out about the key risks to this CNA Financial narrative.
Another view on CNA Financial's value gap
The P/E story suggests CNA Financial is attractively priced, yet the SWS DCF model goes further and estimates future cash flows point to a value of $85.21 per share versus the current $48.16 level. That wide gap frames a different question. Is the discount signalling caution or leaving room for upside if assumptions hold?
Look into how the SWS DCF model arrives at its fair value.
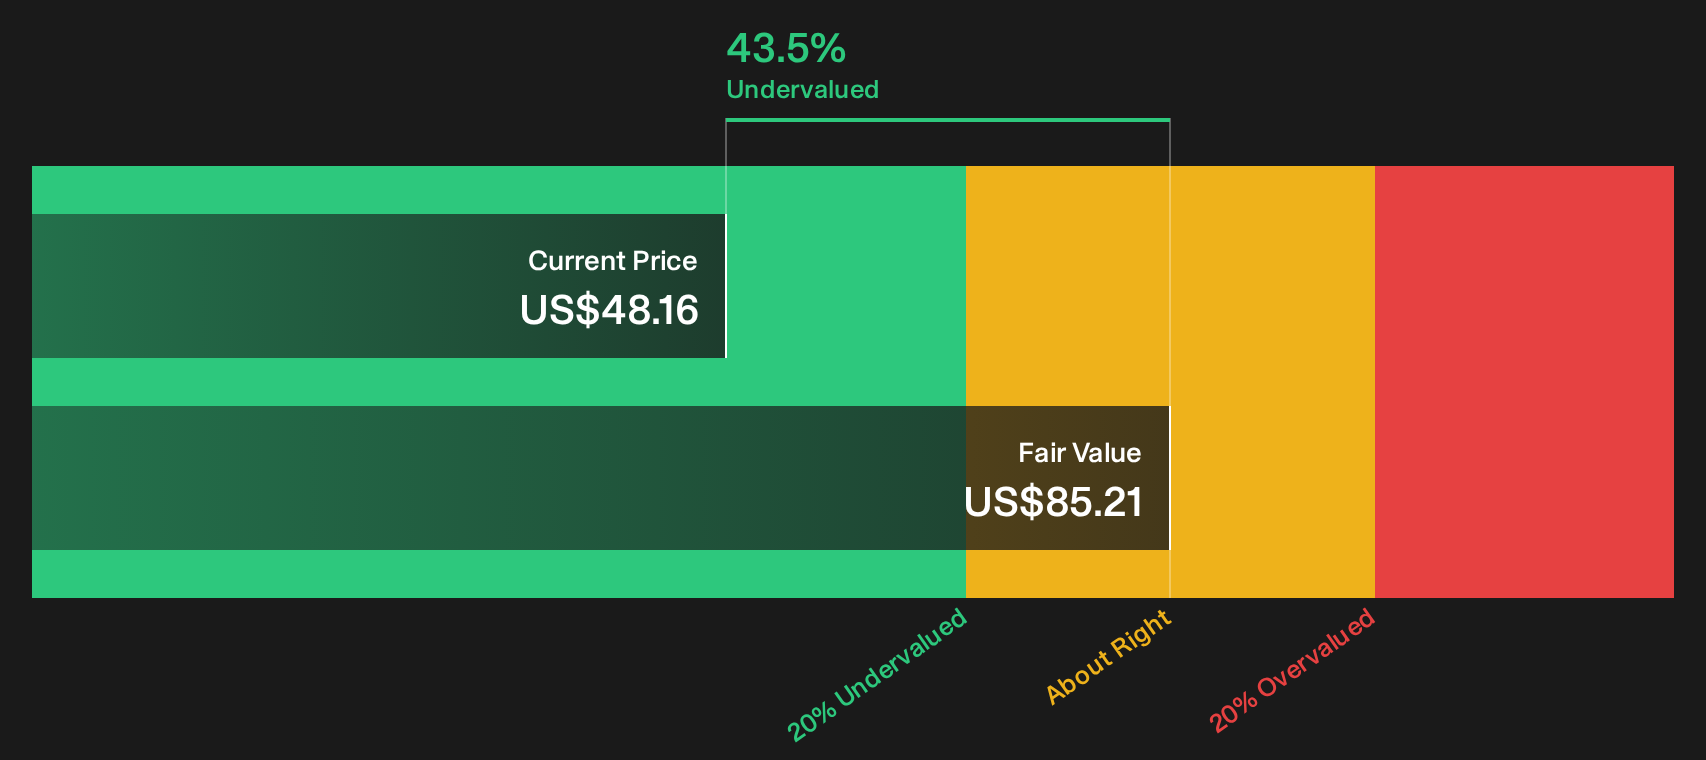
Simply Wall St performs a discounted cash flow (DCF) on every stock in the world every day (check out CNA Financial for example). We show the entire calculation in full. You can track the result in your watchlist or portfolio and be alerted when this changes, or use our stock screener to discover 36 high quality undervalued stocks. If you save a screener we even alert you when new companies match - so you never miss a potential opportunity.
Next Steps
Mixed messages on value and risk rarely resolve themselves slowly. Treat this as a prompt to review CNA Financial on your own terms and weigh both caution and optimism with fresh eyes using the 3 key rewards and 2 important warning signs.
Looking for more investment ideas beyond CNA Financial?
If CNA Financial has sharpened your thinking on value and income, do not stop there. A wider watchlist gives you more options when markets move.
- Target resilient balance sheets and steady fundamentals by scanning our list of solid balance sheet and fundamentals (24 results), which filters for businesses built to handle tougher conditions.
- Hunt for quality at a discount through the 20 high quality undiscovered gems, which surfaces companies with strong underlying numbers that many investors overlook.
- Build a cash flow focused watchlist with the 5 dividend fortresses, which highlights income opportunities with yields that may complement holdings like CNA Financial.
Have feedback on this article? Concerned about the content? Get in touch with us directly. Alternatively, email editorial-team@simplywallst.com