


MSCI (MSCI) is back in focus after reporting revenue up 12.4% year on year, topping market expectations and coinciding with a 16.4% share price move since the earnings release.
The recent revenue surprise has arrived alongside momentum in MSCI’s share price, with a 30-day share price return of 16.23% and a 90-day share price return of 16.67% suggesting buyers are leaning in as earnings and the Brazil index partnership feed into sentiment. Over the longer haul, the 1-year total shareholder return of 14.01% and 3-year total shareholder return of 31.35% point to gains that have built gradually rather than in a single spike, even though the 5-year total shareholder return of 2.86% shows that earlier years were far less rewarding for holders.
Scan how MSCI fits alongside other high quality compounders by comparing it with our curated list of 36 high quality undervalued stocks showing solid cash generation and balance sheets.
MSCI’s sharp post earnings jump could be read as a clean vote of confidence in the business, or as sentiment running ahead of itself. It is time to see which story the current valuation supports.
Most Popular Narrative: 14% Undervalued
On the latest numbers, the narrative fair value for MSCI sits at $762.58 compared with a last close of $656.86. This points to a valuation gap that has caught community attention and raised fresh questions about how durable the business model really is.
According to Jobeda, an investor in the Simply Wall St Community, the appeal starts with how MSCI earns its money through recurring contracts and high margin data products that are woven into the plumbing of global investing.
MSCI sells indexes, data, analytics and investment tools to asset managers, institutional investors, banks, insurers and other financial institutions. Much of the revenue is subscription or recurring in nature.
See why 8 investors see MSCI as 14% undervalued.
That narrative leans heavily on MSCI’s mix of predictable income streams and capital light economics, backed by a net profit margin of 40.7% on $3.4b in revenue and earnings growth that has averaged 12.8% per year over the past 5 years.
The community valuation work behind that $762.58 figure uses a discount rate of 8.10%. Contributors view this as an appropriate return hurdle for a mature, profitable financial data group with high recurring revenue and meaningful operating leverage.
Set against the recent 14.0% 1 year total return and 31.35% 3 year performance, the current 9.2% discount to an estimated future cash flow value and the 13.9% gap to the narrative fair value together suggest a situation where sentiment has improved, yet some investors still view the stock as not fully pricing in MSCI’s cash generation and earnings quality.
Result: Fair Value of $762.58 (UNDERVALUED)
Still, the MSCI story can wobble if asset-based fee growth slows or if clients push back on pricing as index and data competition intensifies.
Find out about the key risks to this MSCI narrative.
Another View on MSCI’s Valuation
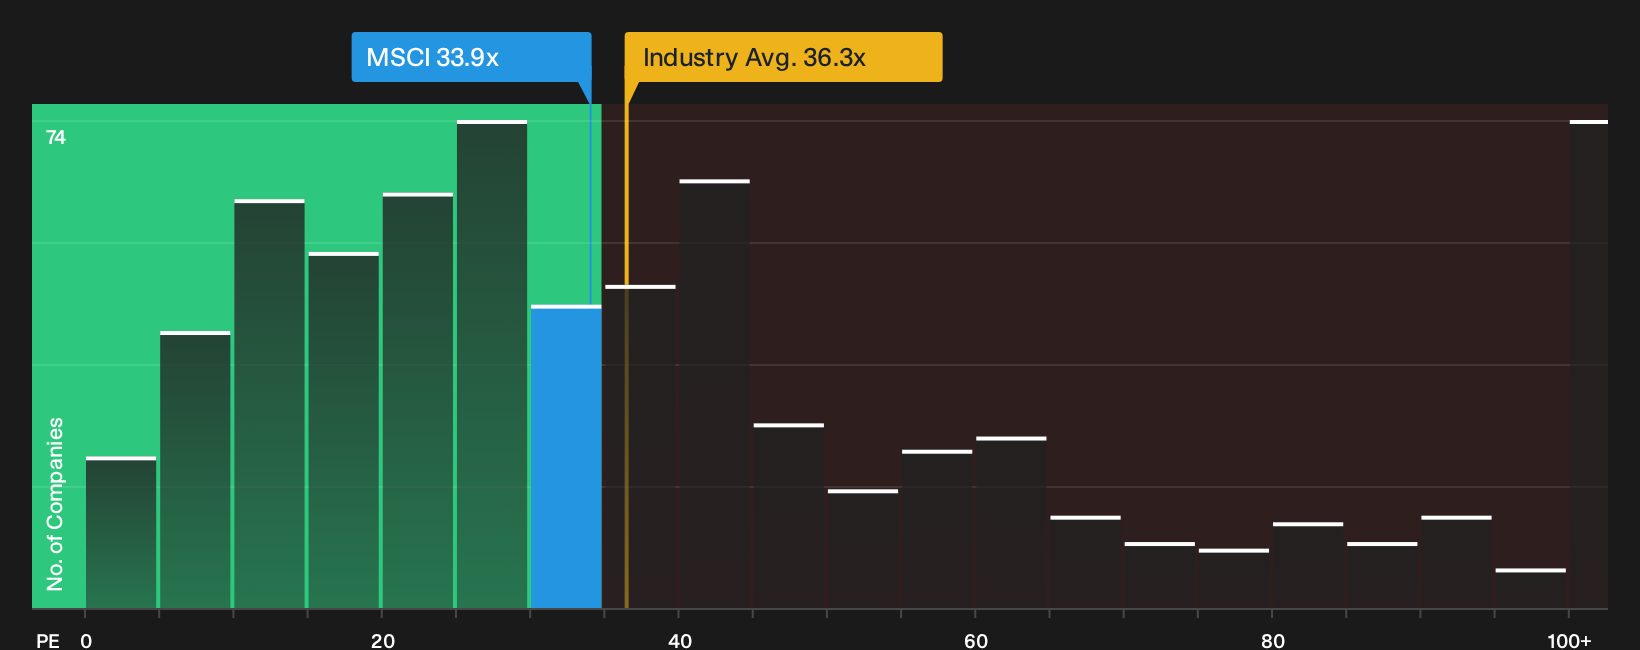
There is a different reading of MSCI when you look at the P/E. The stock trades on 33.9x earnings, which is below the US Capital Markets average of 36.3x but more than double its fair ratio of 15.9x. That gap points to meaningful valuation risk if sentiment cools, even if quality remains high. Does that premium multiple feel comfortable for you?
For a closer look at what the current price implies across earnings and peers, See what the numbers say about this price — find out in our valuation breakdown.
Next Steps
Mixed messages on MSCI’s value story so far. Now is the moment to move fast, review the full data, weigh both sides, and decide whether the 3 key rewards and 2 important warning signs aligns with your view.
Looking for more investment ideas beyond MSCI?
If MSCI has sharpened your focus on quality, now is the moment to widen the lens and line up your next potential opportunities before others do.
- Target resilient income by reviewing companies that appear built for durability with 5 dividend fortresses.
- Spot potential mispricings early by scanning a curated 20 high quality undiscovered gems list that filters for strong fundamentals.
- Prioritize peace of mind by zeroing in on a 30 resilient stocks with low risk scores that concentrates on resilient businesses with lower risk scores.
Have feedback on this article? Concerned about the content? Get in touch with us directly. Alternatively, email editorial-team@simplywallst.com