


Universal Display (OLED) has expanded its automotive footprint by teaming up with OLEDWorks to test cyan OLED lighting as a communication tool for automated driving systems and future vehicle interaction concepts.
Short term momentum has picked up for Universal Display, with a 1 month share price return of 20.57% and a 7 day gain of 1.10%, taking the stock to US$90.38, even though the year to date share price return is down 25.83% and the 5 year total shareholder return is down 42.88%.
Scan other potential beneficiaries of the same trend by comparing Universal Display with a curated group of 53 AI infrastructure stocks that are powering next-generation automotive and automation technology.
The rebound in Universal Display’s share price has opened a wide gap between the current US$90 level and the range of analyst estimates near US$115. How far does fair value really stretch between those anchors?
Most Popular Narrative: 22% Undervalued
Universal Display's last close at $90.38 sits well below the fair value of about $115 from the analyst consensus Narrative on Simply Wall St. This applies an 11.28% discount rate to analysts' revenue and earnings forecasts to arrive at that anchor.
The main factor that has to go right is that Universal Display converts its phosphorescent blue and related architectures into broad commercial adoption, after demonstrating efficiency and lifetime attributes in prototypes and early customer products.
See why 29 investors see Universal Display as 22% undervalued.
Result: Fair Value of $115.37 (UNDERVALUED)
Still, the narrative around Universal Display can unravel if weaker smartphone demand persists and if OLED material orders remain volatile enough to pressure margins and guidance.
Find out about the key risks to this Universal Display narrative.
Another View: SWS DCF Flags A Very Different Fair Value
Universal Display may look attractive compared with the analyst fair value estimate of about $115, yet the Simply Wall St DCF model presents a very different picture. On that cash flow view, the estimated value is around $39.66, which indicates that the current $90.38 price is well above that level. Which perspective do you consider more useful for a long-term decision?
For a closer look at the components behind that cash flow outcome, including the assumptions used for growth and discount rates, Look into how the SWS DCF model arrives at its fair value.
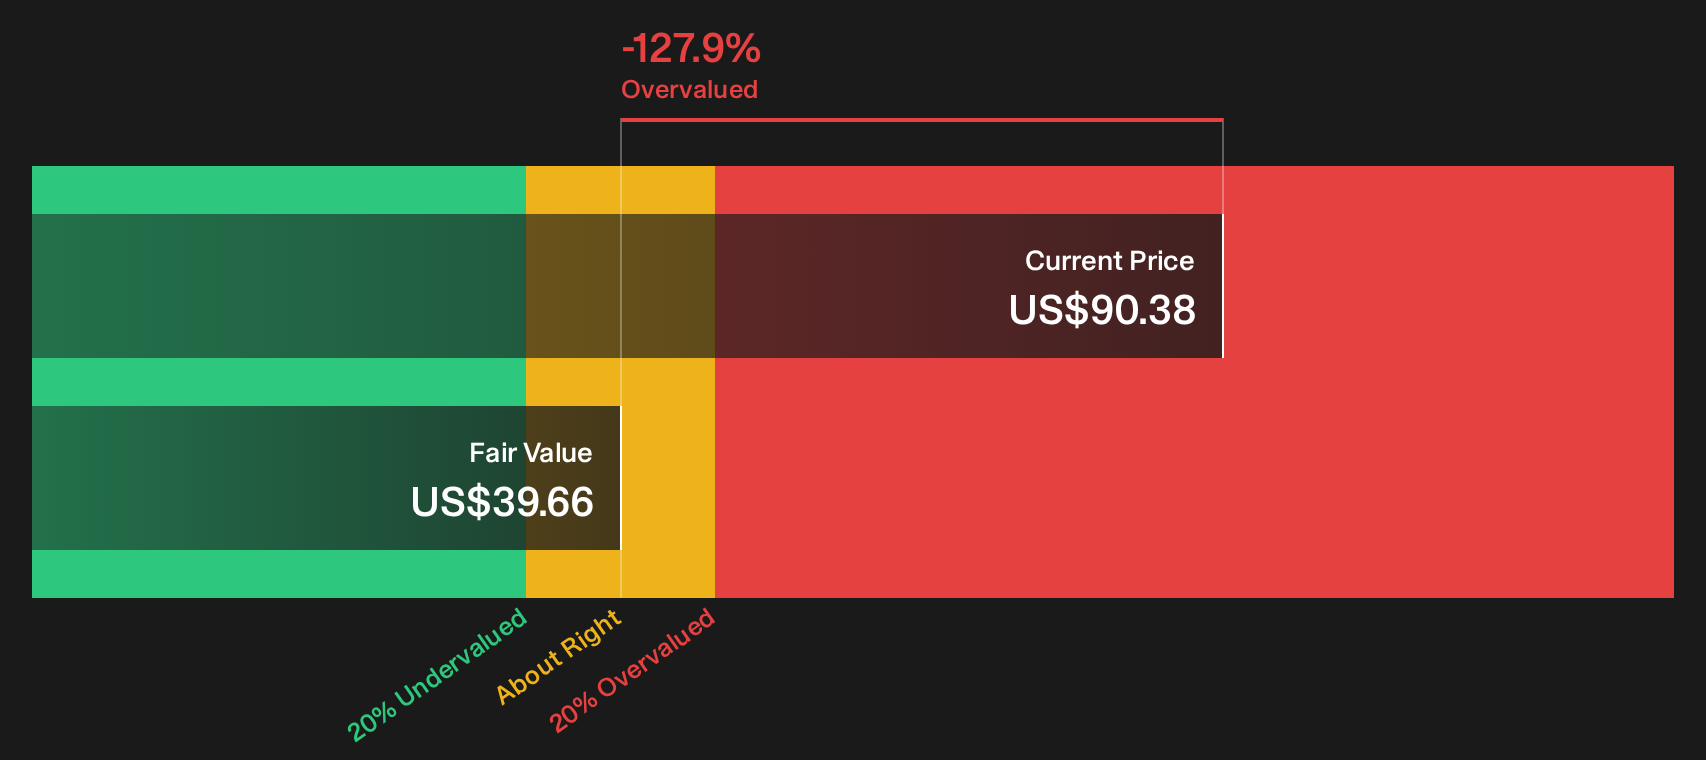
Simply Wall St performs a discounted cash flow (DCF) on every stock in the world every day (check out Universal Display for example). We show the entire calculation in full. You can track the result in your watchlist or portfolio and be alerted when this changes, or use our stock screener to discover 35 high quality undervalued stocks. If you save a screener we even alert you when new companies match - so you never miss a potential opportunity.
Next Steps
Mixed signals around Universal Display can feel confusing. Move quickly on your own homework by weighing both sides of the story with the 4 key rewards and 1 important warning sign
Looking for more Universal Display investment ideas?
If Universal Display has sharpened your interest, do not stop here. Broaden your watchlist and pressure test your thesis against other opportunities lining up for capital.
- Target quality at a discount by reviewing the 35 high quality undervalued stocks that pair strong fundamentals with prices that sit below many investors' expectations.
- Strengthen your income stream by scanning the 5 dividend fortresses that focus on higher yields supported by more robust financial profiles.
- Dial down portfolio stress by filtering for the 30 resilient stocks with low risk scores that score well on resilience and balance sheet strength.
Have feedback on this article? Concerned about the content? Get in touch with us directly. Alternatively, email editorial-team@simplywallst.com