


MGE Energy (MGEE) just released third quarter and nine month earnings, giving investors fresh numbers on revenue, profit and earnings per share that now frame how the stock’s recent move looks.
The latest earnings update arrived in a market that had already started to warm to MGE Energy. The 30 day share price return of 12.82% hints at rising optimism after a quiet year, where the share price return year to date is 1.63% and the 1 year total shareholder return is slightly down at 2.77%. The 3 and 5 year total shareholder returns of 14.16% and 20.29% point to a steadier long term record.
Scan beyond MGE Energy's latest earnings jump and compare it with a hand picked group of utilities and infrastructure stocks in the 41 power grid technology and infrastructure stocks to see how the sector is pricing steady demand.
After a sharp 30 day rebound and earnings that reset expectations, the real puzzle for MGE Energy now is simple: Is most of the rerating already in the price, or is there meaningful upside still on the table?
Price-to-Earnings of 18.7x: Is it justified?
MGE Energy trades on a P/E of 18.7x, very slightly above its peer group at 18.5x and above an estimated fair P/E of 17x, which points to a stock that is priced a bit richer than the sector for the same dollar of earnings.
The P/E ratio compares the share price with earnings per share, so it tells you how much investors are willing to pay today for current profitability. For a regulated utility like MGE Energy, that lens matters because revenue and profit growth are usually constrained by allowed returns and capital plans rather than rapid swings in demand.
Earnings have grown 20% over the past year and 7.8% per year over five years, with net profit margins at 21.1% compared with 19% a year earlier. That record, together with high quality earnings, helps explain why the market is prepared to value MGE Energy slightly above the peer average. Yet the P/E of 18.7x also sits above an estimated fair P/E of 17x. This suggests the valuation could migrate closer to that level if sentiment cools or growth expectations ease.
The current P/E of 18.7x is a touch more expensive than the US Electric Utilities industry at 19.3x. This keeps MGE Energy roughly in line with the sector while leaving little obvious discount to compensate for forecast revenue growth of 4.8% per year and earnings growth of 7.1% per year that are both slower than broader US market forecasts.
Explore the SWS fair ratio for MGE Energy.
Result: Price-to-Earnings of 18.7x (ABOUT RIGHT)
Still, the recent 30 day rebound and a valuation slightly above the estimated fair P/E could unwind quickly if earnings momentum or allowed returns disappoint.
Find out about the key risks to this MGE Energy narrative.
Another View on MGE Energy: Cash Flows Paint a Harsher Picture
P/E suggests MGE Energy is only slightly rich, yet the SWS DCF model points a different way. With the shares at $79.72 and an estimated future cash flow value of $61.08, the stock screens as overvalued on this method. That raises a simple question: Are investors paying today for cash flows that may not materialise on that schedule?
Look into how the SWS DCF model arrives at its fair value.
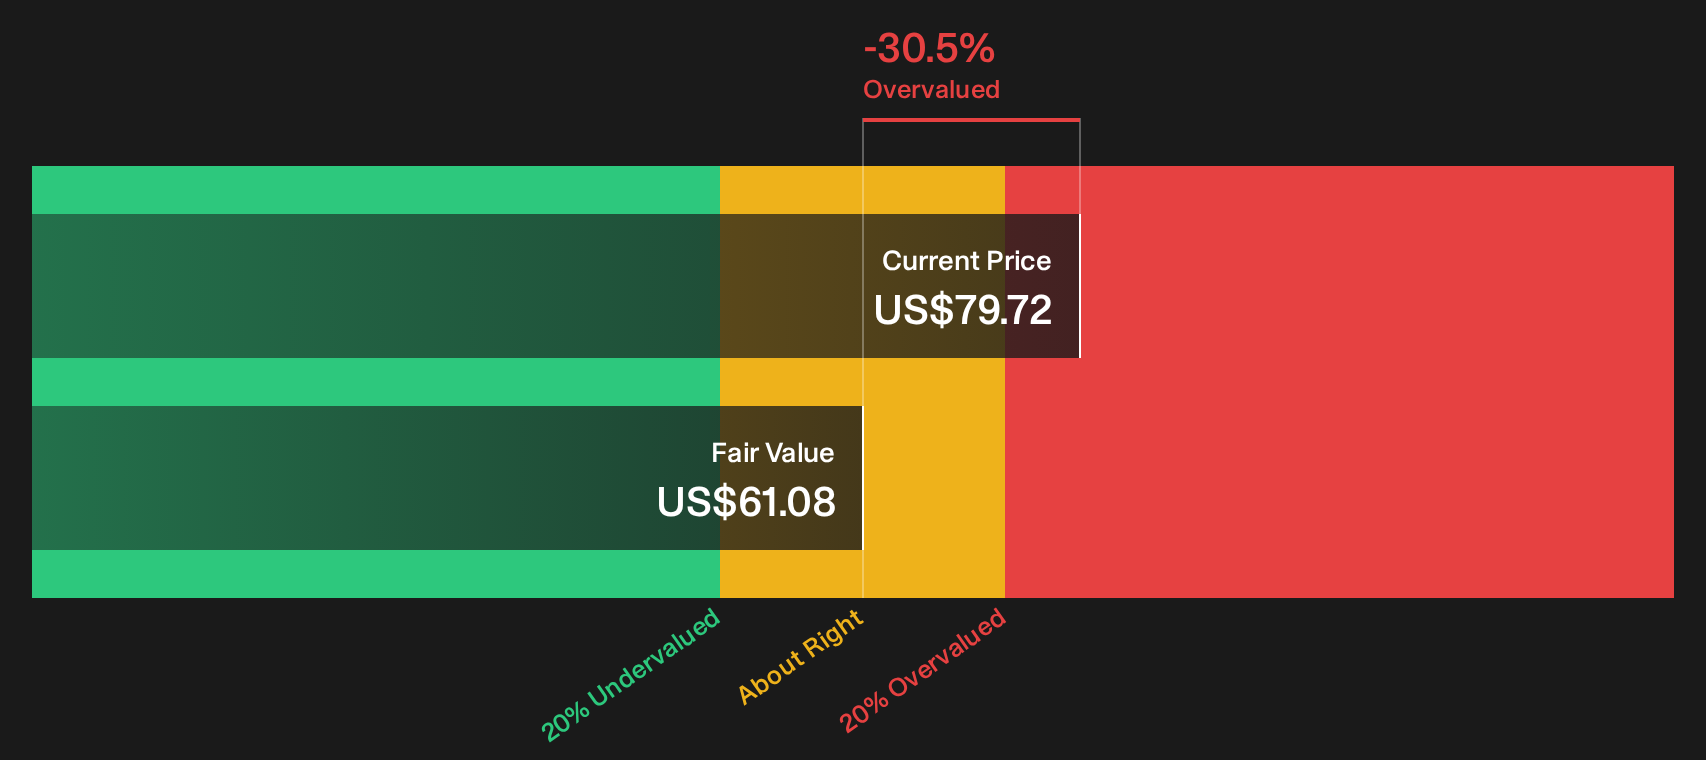
Simply Wall St performs a discounted cash flow (DCF) on every stock in the world every day (check out MGE Energy for example). We show the entire calculation in full. You can track the result in your watchlist or portfolio and be alerted when this changes, or use our stock screener to discover 35 high quality undervalued stocks. If you save a screener we even alert you when new companies match - so you never miss a potential opportunity.
Next Steps
If the mixed signals on MGE Energy leave you undecided, that is exactly the point where you should lean into the data and move fast to shape your own view using the 3 key rewards and 2 important warning signs.
Looking for more investment ideas beyond MGE Energy?
If MGE Energy sharpened your focus on valuation, you can use that momentum to expand your watchlist with a few targeted stock ideas built from hard numbers.
- Target potential mispricing by scanning a curated group of quality companies that still trade below their implied worth through the 35 high quality undervalued stocks.
- Strengthen the income side of your portfolio by checking out reliable payers in the 5 dividend fortresses that combine yield with durability.
- Dial down portfolio risk by filtering for resilient businesses with robust finances using the 30 resilient stocks with low risk scores.
Have feedback on this article? Concerned about the content? Get in touch with us directly. Alternatively, email editorial-team@simplywallst.com