


Champion Homes (SKY) just posted second quarter results that mixed higher sales and a bigger order backlog with softer margins and earnings. For investors, the earnings update and housing policy backdrop are now front and center.
Champion Homes’ share price has climbed 9.32% year to date and 16.56% over the past month, even after a 3.70% dip on the latest earnings reaction. A 10.46% one-year total shareholder return and 49.04% three-year total shareholder return point to momentum that investors are still weighing against current valuation and housing policy support.
Compare Champion Homes’ policy supported momentum with other potential housing and construction plays by scanning the list of solid balance sheet and fundamentals (24 results) to identify those that could handle margin pressure and demand swings more resiliently.
Bulls point to Champion Homes’ order book, housing policy tailwinds and recent share price strength. Bears highlight softer earnings and margin pressure. Which story shows up more clearly once you line this against today’s valuation?
Preferred P/E of 26.9x for Champion Homes: Is it justified?
Valuation for Champion Homes is being framed by a P/E of 26.9x at a last close of $92.82, which screens as expensive against both its own fair P/E estimate and peers.
The P/E multiple compares what investors pay today for each dollar of current earnings. For a factory-built housing producer like Champion Homes, that ratio effectively reflects how much optimism the market is willing to assign to future profit trends in what can be a cyclical end market.
Here, the market is paying 26.9x earnings, while the estimated fair P/E sits at 21.2x. That gap suggests investors are assigning a richer tag to Champion Homes than the level the fair ratio implies the valuation could move toward, even as earnings have declined by 10% per year over the past 5 years and net profit margins have eased from 8.4% to 6.8%.
Against the broader Consumer Durables group, the contrast is even sharper. The sector trades on an average P/E of 14.6x, so Champion Homes carries a materially higher earnings multiple than industry peers, indicating the market is currently pricing in stronger profit progression or greater resilience than the typical stock in the group.
Explore the SWS fair ratio for Champion Homes.
Result: Price-to-Earnings of 26.9x (OVERVALUED)
Still, Champion Homes faces clear pressure points if housing policy support wanes or if earnings and margins fail to match the premium 26.9x P/E tag.
Find out about the key risks to this Champion Homes narrative.
Another view on Champion Homes’ value
The premium P/E on Champion Homes looks different when set beside the SWS DCF model. At $92.82, the stock trades above an SWS estimate of future cash flow value of $89.89, which points to a mildly overvalued picture rather than a clear discount. That raises a simple question: Is the current price paying up for policy support and backlog strength, or just leaning on optimistic assumptions about future cash generation?
Look into how the SWS DCF model arrives at its fair value.
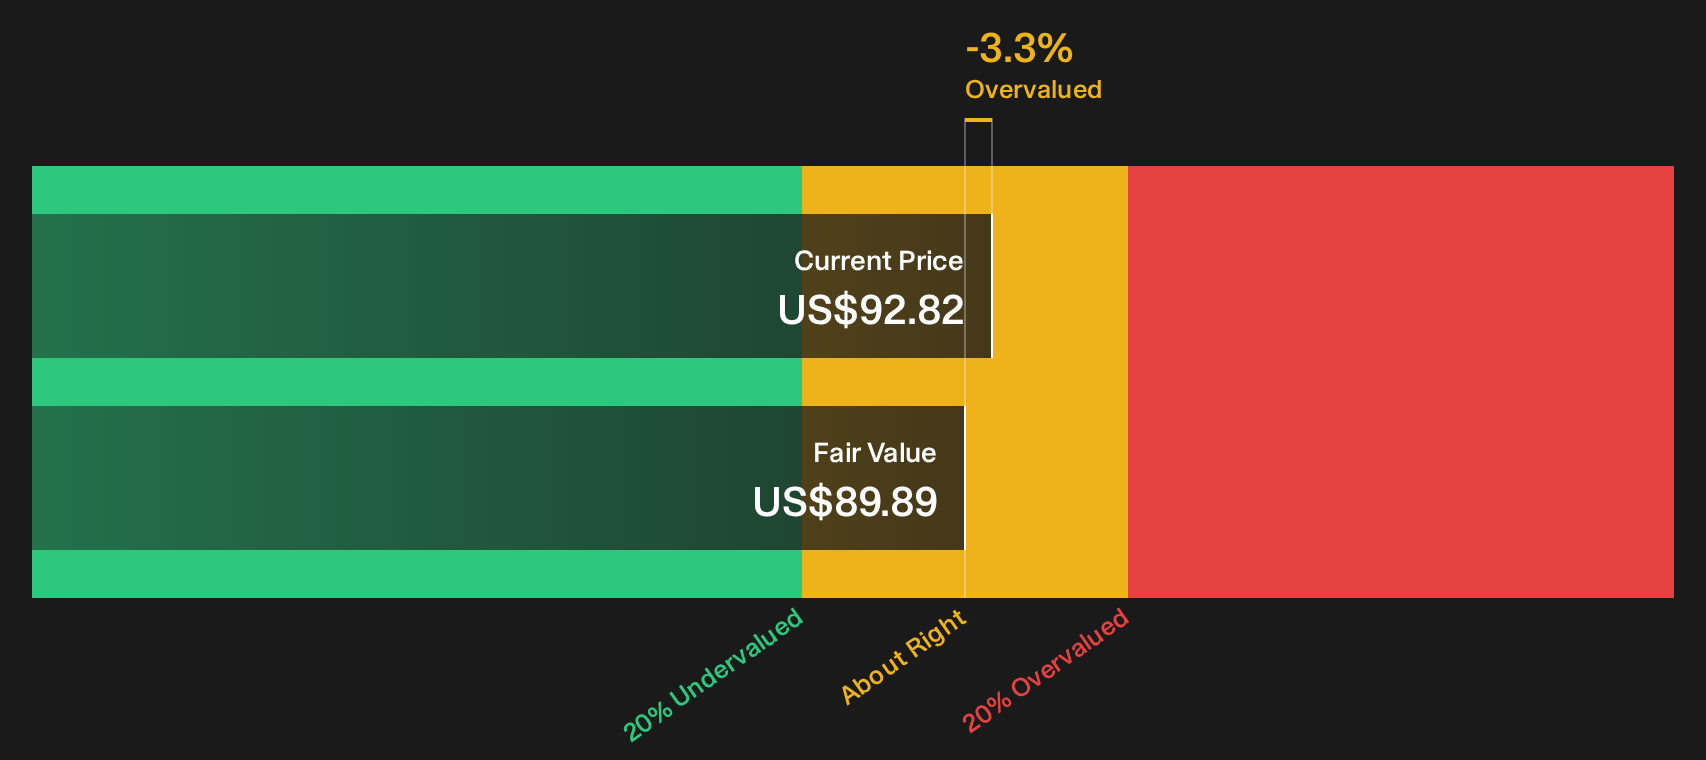
Simply Wall St performs a discounted cash flow (DCF) on every stock in the world every day (check out Champion Homes for example). We show the entire calculation in full. You can track the result in your watchlist or portfolio and be alerted when this changes, or use our stock screener to discover 35 high quality undervalued stocks. If you save a screener we even alert you when new companies match - so you never miss a potential opportunity.
Next Steps
Question whether the bullish tone around Champion Homes really fits the numbers. Move quickly from headline takes to hard data and stress test your own thesis with the 1 key reward.
Looking for more investment ideas beyond Champion Homes?
If Champion Homes has your attention, use that momentum. Fresh ideas often come from comparing it against other businesses with very different risk and return profiles.
Use the Simply Wall Street Screener to uncover three very different sets of opportunities that could sharpen your watchlist.
- Chase potential mispricing by scanning a focused list of companies that currently screen as high quality and overlooked using the 20 high quality undiscovered gems.
- Prioritise resilience by reviewing a curated 30 resilient stocks with low risk scores that filters for businesses with sturdier risk profiles and fewer red flags.
- Target value and quality together by comparing Champion Homes with a 35 high quality undervalued stocks that blends stronger balance sheets with more modest pricing.
Have feedback on this article? Concerned about the content? Get in touch with us directly. Alternatively, email editorial-team@simplywallst.com