


White Mountains Insurance Group (WTM) just posted third quarter 2026 results that shifted from profit to a net loss, alongside softer revenue and an almost fully executed multi year buyback.
Despite a weaker third quarter, White Mountains Insurance Group’s recent trading performance has been resilient, with a 30-day share price return of 10.65% and an 11.66% year-to-date gain at a last close of US$2,280.
Scan how White Mountains Insurance Group stacks up against other resilient financials by reviewing the hand picked 30 resilient stocks with low risk scores that have kept risk scores in focus after tough earnings updates.After a weak quarter and a sharp rebound to US$2,280, White Mountains Insurance Group now forces a choice. Do you pay up after the bounce, or wait for a cleaner entry as the valuation picture comes into focus next?
Preferred P/E of 5.7x: Is it justified?
On Simply Wall St’s numbers, White Mountains Insurance Group trades on a P/E of 5.7x, which sits against a last close of $2,280 and points to a valuation that looks cheaper than many peers based on current earnings.
The P/E ratio compares what you pay per share to the profits that the business generates for each share. For an insurer like White Mountains Insurance Group that already reports material earnings, this measure gives a quick read on how much the market is willing to pay for every dollar of profit today.
WTM’s 5.7x P/E sits well below both the US Insurance industry average of 11.6x and the peer group average of 11.2x. That wide gap suggests the market is pricing White Mountains Insurance Group’s earnings at a large discount to many comparable financial stocks, rather than paying up in line with sector norms.
See what the numbers say about this price — find out in our valuation breakdown.
Result: Price-to-earnings of 5.7x (UNDERVALUED)
Still, the recent net loss and heavy reliance on property and specialty reinsurance leave White Mountains Insurance Group exposed if underwriting conditions or catastrophe activity worsen.
Find out about the key risks to this White Mountains Insurance Group narrative.
Another view on White Mountains Insurance Group’s value
The earlier P/E work presents White Mountains Insurance Group as inexpensive based on current earnings. A different lens tells a similar story. Simply Wall St’s DCF model estimates the value of future cash flows at about $3,780.88 per share, compared with the recent $2,280 price, which suggests a very wide gap for investors to consider.
Our DCF model relies on long term cash flow assumptions rather than today’s earnings multiple. When one method indicates a discount and a second, independent model also points to undervaluation, the key question is how much confidence you have in those underlying cash flow forecasts and how patiently you are prepared to wait for the market to respond.
Look into how the SWS DCF model arrives at its fair value.
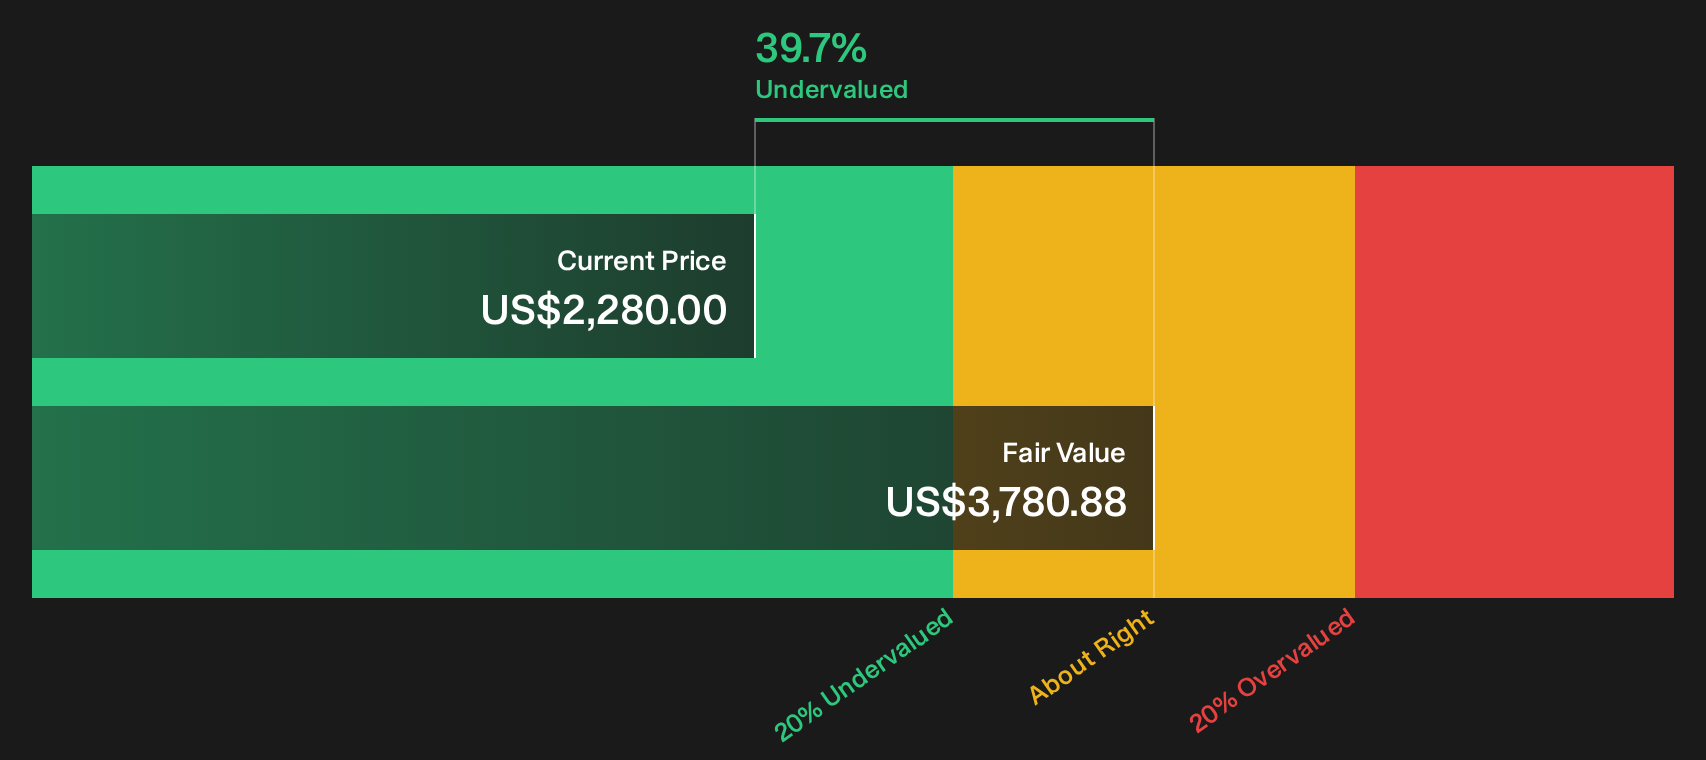
Simply Wall St performs a discounted cash flow (DCF) on every stock in the world every day (check out White Mountains Insurance Group for example). We show the entire calculation in full. You can track the result in your watchlist or portfolio and be alerted when this changes, or use our stock screener to discover 35 high quality undervalued stocks. If you save a screener we even alert you when new companies match - so you never miss a potential opportunity.
Next Steps
Mixed signals around White Mountains Insurance Group can create hesitation, but waiting too long can become a decision in itself. Pressure test the bullish and cautious cases side by side with the 2 key rewards and 1 important warning sign
Looking for more investment ideas beyond White Mountains Insurance Group?
If White Mountains Insurance Group has you rethinking your watchlist, this is the moment to cast the net wider and pressure test fresh ideas with real data.
- Target more resilient balance sheets by scanning a list of solid balance sheet and fundamentals (24 results) that filters for companies prioritizing financial strength when conditions turn difficult.
- Find potential mispriced opportunities by running through a 35 high quality undervalued stocks that narrows the field to quality stocks trading below their estimated worth.
- Hunt for future market leaders early by reviewing a 20 high quality undiscovered gems focused on lesser known businesses with solid underlying fundamentals.
Have feedback on this article? Concerned about the content? Get in touch with us directly. Alternatively, email editorial-team@simplywallst.com