


CCI Group (TSE:7381) put fresh numbers on the table at the end of October, lifting both earnings and dividend guidance after stronger contributions from The Hokkoku Bank subsidiary and a more favourable tax outlook.
For shareholders watching CCI Group, the latest earnings and dividend revisions arrive after a mixed stretch in the market, with the share price falling about 9% over the past three months, while still delivering a 35.11% year to date share price return and an 81.59% total shareholder return over the past year. This suggests that long term momentum has been strong, even as traders reassess short term expectations around the new guidance.
Capitalize on the momentum shift around CCI Group and scan a curated set of banks and financials with resilient balance sheets through the list of solid balance sheet and fundamentals (23 results).The guidance upgrade, recent share price pullback and a value score of 1 present a conflicting picture around CCI Group. Is the current discount to intrinsic value a genuine opportunity, or a warning sign that the market has it right?
Preferred P/E of 13.9x for CCI Group: Is it justified?
On the surface, CCI Group trades on a P/E of 13.9x, which sits slightly above the JP Banks industry average of 13.4x but below the peer group average of 15.2x. That positioning suggests investors are paying a modest premium to the broader banking sector while still accepting a discount to closer peers.
The P/E ratio compares the current share price to earnings per share. For a bank like CCI Group, it gives you a quick read on how much the market is willing to pay for each unit of profit. This can be especially useful where asset based measures are harder to interpret than for industrial businesses.
Here the picture is mixed. CCI Group is described as expensive relative to the wider JP Banks industry on a P/E of 13.9x compared to 13.4x, which points to the market assigning slightly higher expectations than the average bank. At the same time, that same 13.9x multiple is flagged as good value versus its closer peer set average of 15.2x, which signals that, inside its own comparison group, the shares trade at a lower earnings multiple than many similar institutions.
See what the numbers say about this price — find out in our valuation breakdown.
Result: Price-to-Earnings of 13.9x (ABOUT RIGHT)
Still, the narrative around CCI Group could be derailed if earnings from core banking weaken, or if fresh regulatory requirements compress profitability and capital flexibility.
Find out about the key risks to this CCI Group narrative.
Another view on CCI Group's value
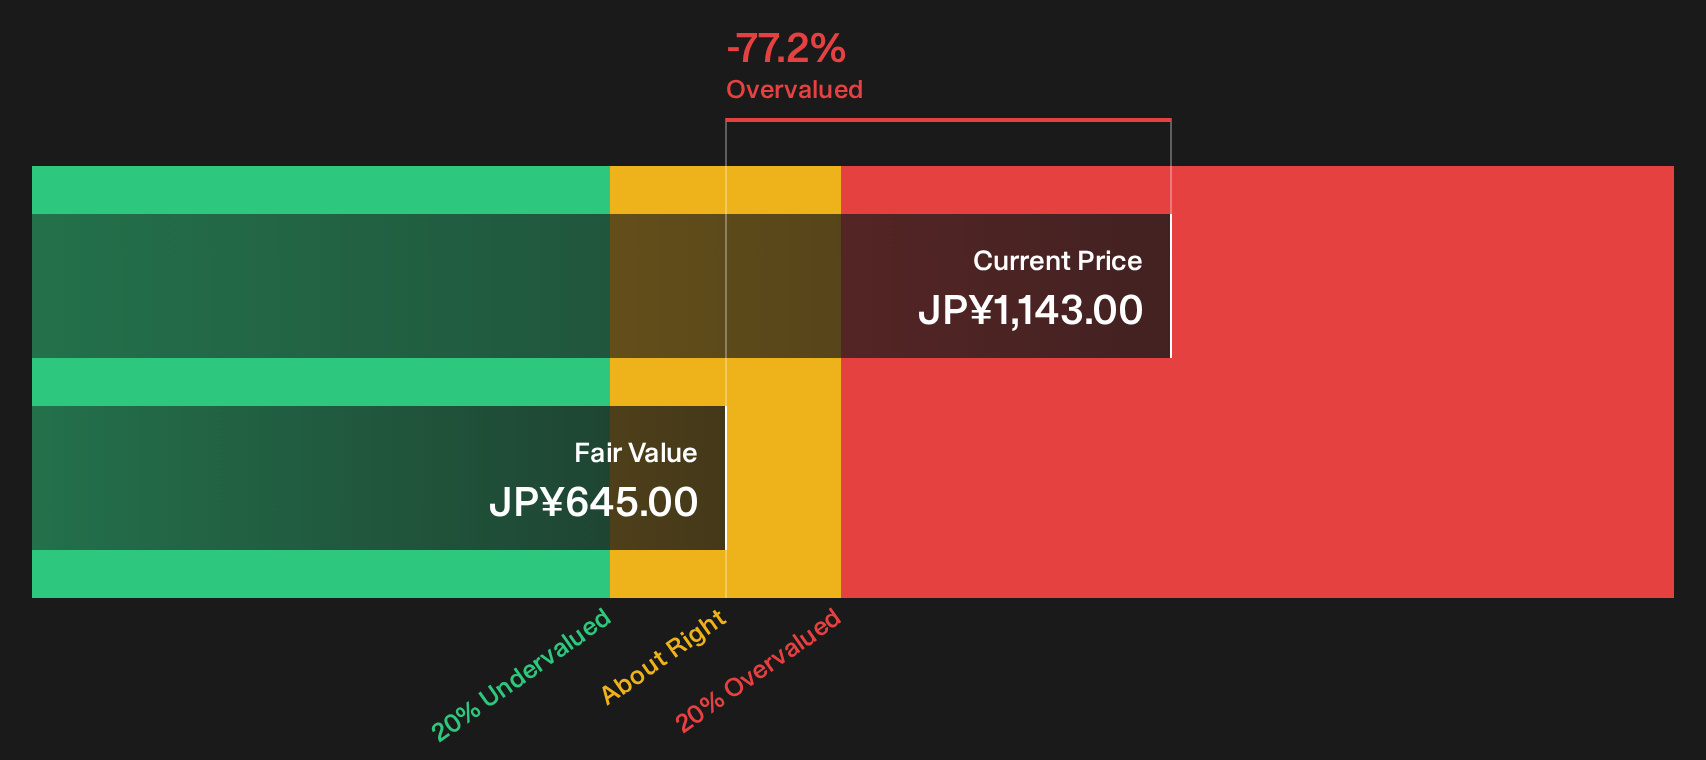
The earnings multiple paints one picture, but the SWS DCF model points in the opposite direction. On that cash flow view, CCI Group at ¥1,143 screens as overvalued against an estimated future cash flow value of ¥645, which implies limited downside protection if the story turns.
For anyone weighing up these conflicting signals, it helps to see exactly how that gap is calculated through the Look into how the SWS DCF model arrives at its fair value.
Simply Wall St performs a discounted cash flow (DCF) on every stock in the world every day (check out CCI Group for example). We show the entire calculation in full. You can track the result in your watchlist or portfolio and be alerted when this changes, or use our stock screener to discover 23 high quality undervalued stocks. If you save a screener we even alert you when new companies match - so you never miss a potential opportunity.
Next Steps
Conflicting signals on CCI Group's valuation and guidance can feel messy, so move quickly, review the full picture of risks and rewards, and weigh the 1 key reward and 4 important warning signs
Looking for more investment ideas beyond CCI Group?
Do not stop your research with CCI Group. Broader opportunity sets often reveal better fits for your goals than a single stock ever can.
- Target steadier potential outcomes by scanning resilient businesses with low risk scores through the 19 resilient stocks with low risk scores.
- Hunt for quality at a discount by checking companies that screen as high quality undervalued ideas via the 23 high quality undervalued stocks.
- Strengthen your income playbook by reviewing dependable payers and their yields using the 29 dividend fortresses.
Have feedback on this article? Concerned about the content? Get in touch with us directly. Alternatively, email editorial-team@simplywallst.com