


Nordic American Tankers (NAT) recently reported robust earnings, supported by an average Time Charter Equivalent of about $144,000 per day on recent spot voyage fixtures, drawing fresh attention to the stock.
The recent pullback, with a 7 day share price return of down 12.63% and a 30 day share price return of down 23.26% from the latest US$6.50 level, sits against a much stronger backdrop. Nordic American Tankers has a year to date share price return of 92.88% and a 1 year total shareholder return of 107.24%, suggesting momentum has cooled in the short term even though longer term holders have still seen substantial gains.
Scan for other tanker and energy shipping plays showing similar earnings strength and dividend potential with our curated 20 high quality undiscovered gems before the next round of results reshapes the opportunity set.
After a sharp run followed by a sudden pullback, Nordic American Tankers now sits in very different territory compared with early year buyers. Does the current valuation still skew the risk reward in favour of fresh capital?
Price-to-Earnings of 11.1x: Is it justified?
On a simple valuation check, Nordic American Tankers trades on a P/E of 11.1x, which puts the current $6.50 share price on the richer side compared with several benchmarks.
The P/E ratio compares what investors pay for each dollar of earnings. For a tanker operator with cyclical cash flows and lumpy profits, this gauge often captures how much the market is willing to pay for earnings that may not be smooth year to year.
NAT's earnings growth over the past year was very large at about 7x its five year average rate. This was helped by a one off gain of $52.2m and a net margin of 33.3% compared with 4.4% previously. Against that backdrop, paying a P/E of 11.1x implies the market is putting a premium price on recent profitability. Yet this sits above the US Oil and Gas industry on 10.5x, the peer group on 10.2x, and an estimated fair P/E of 8.7x that the market could move towards if exuberance fades.
Explore the SWS fair ratio for Nordic American Tankers.
Result: Price-to-Earnings of 11.1x (OVERVALUED)
Still, the case for Nordic American Tankers can unravel quickly if tanker day rates soften or if earnings volatility makes that 11.1x P/E look much less secure.
Find out about the key risks to this Nordic American Tankers narrative.
Another View: Cash Flow Signals Tell A Different Story
While the P/E of 11.1x makes Nordic American Tankers look expensive relative to peers, the SWS DCF model paints a softer picture. From that perspective, NAT at $6.50 trades about 4% below an estimated future cash flow value of $6.77. This suggests a mild discount rather than a rich premium. That contrast raises a simple question for you as an investor: Which metric do you trust more, the earnings multiple or the cash flow math?
Look into how the SWS DCF model arrives at its fair value.
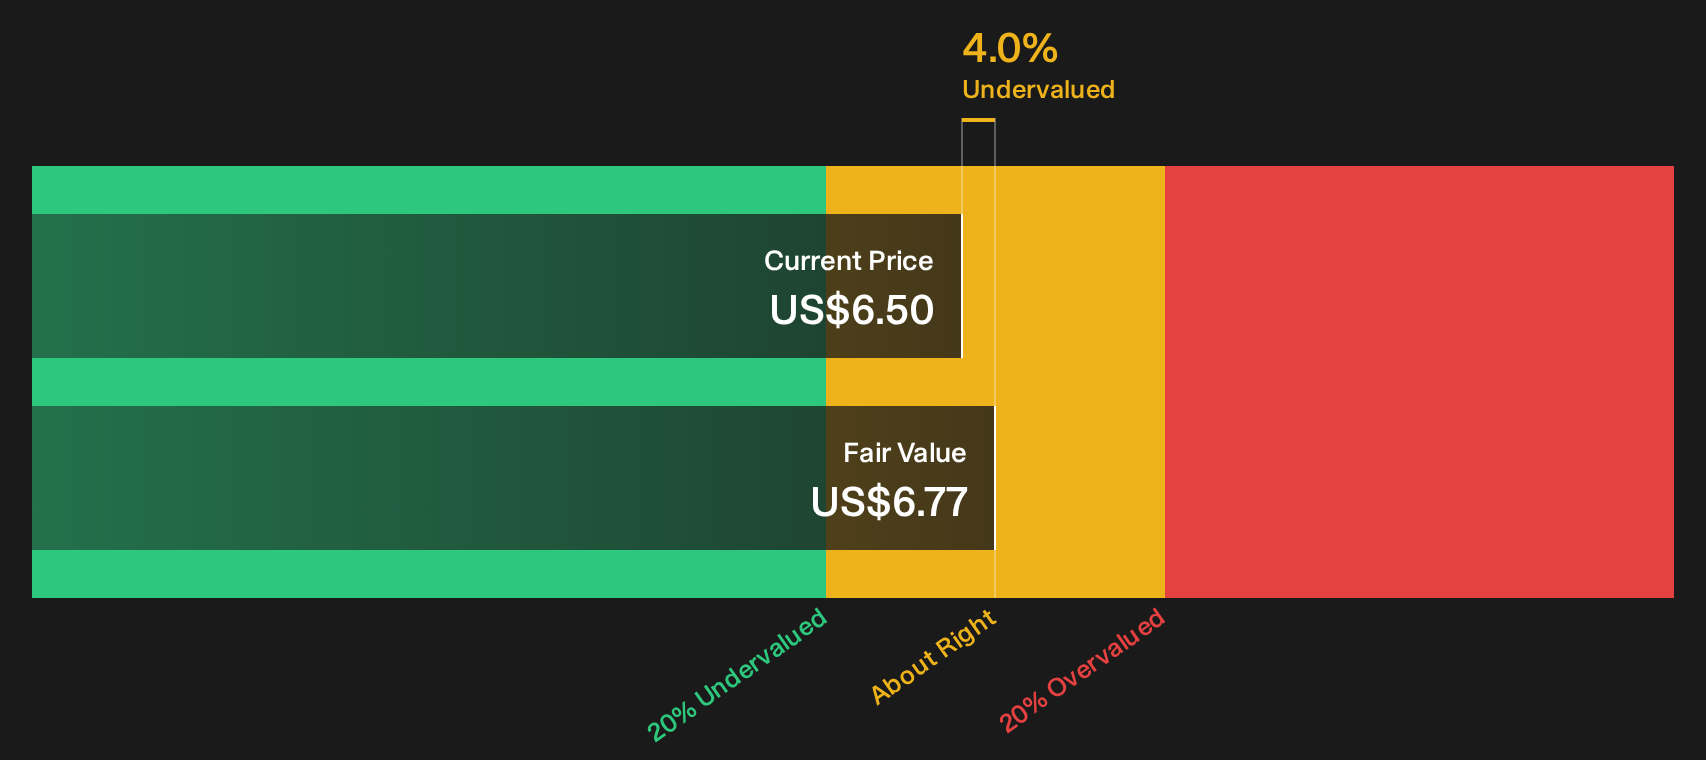
Simply Wall St performs a discounted cash flow (DCF) on every stock in the world every day (check out Nordic American Tankers for example). We show the entire calculation in full. You can track the result in your watchlist or portfolio and be alerted when this changes, or use our stock screener to discover 35 high quality undervalued stocks. If you save a screener we even alert you when new companies match - so you never miss a potential opportunity.
Next Steps
Mixed signals on Nordic American Tankers so far. If you want to act before sentiment flips again, consider both sides by checking the 2 key rewards and 4 important warning signs.
Looking for more investment ideas beyond Nordic American Tankers?
If Nordic American Tankers has sharpened your focus on risk, reward, and income, do not stop here. The next opportunity could be sitting just one screen away.
- Focus on resilient compounding potential by scanning a curated pool of 30 resilient stocks with low risk scores that score well on both stability and fundamental strength.
- Consider both quality and price by tracking a filtered set of 35 high quality undervalued stocks that pair solid financials with what may be appealing entry points.
- Create a cash flow focused shortlist by reviewing a hand picked 5 dividend fortresses that prioritise stronger balance sheets and payout support.
Have feedback on this article? Concerned about the content? Get in touch with us directly. Alternatively, email editorial-team@simplywallst.com