


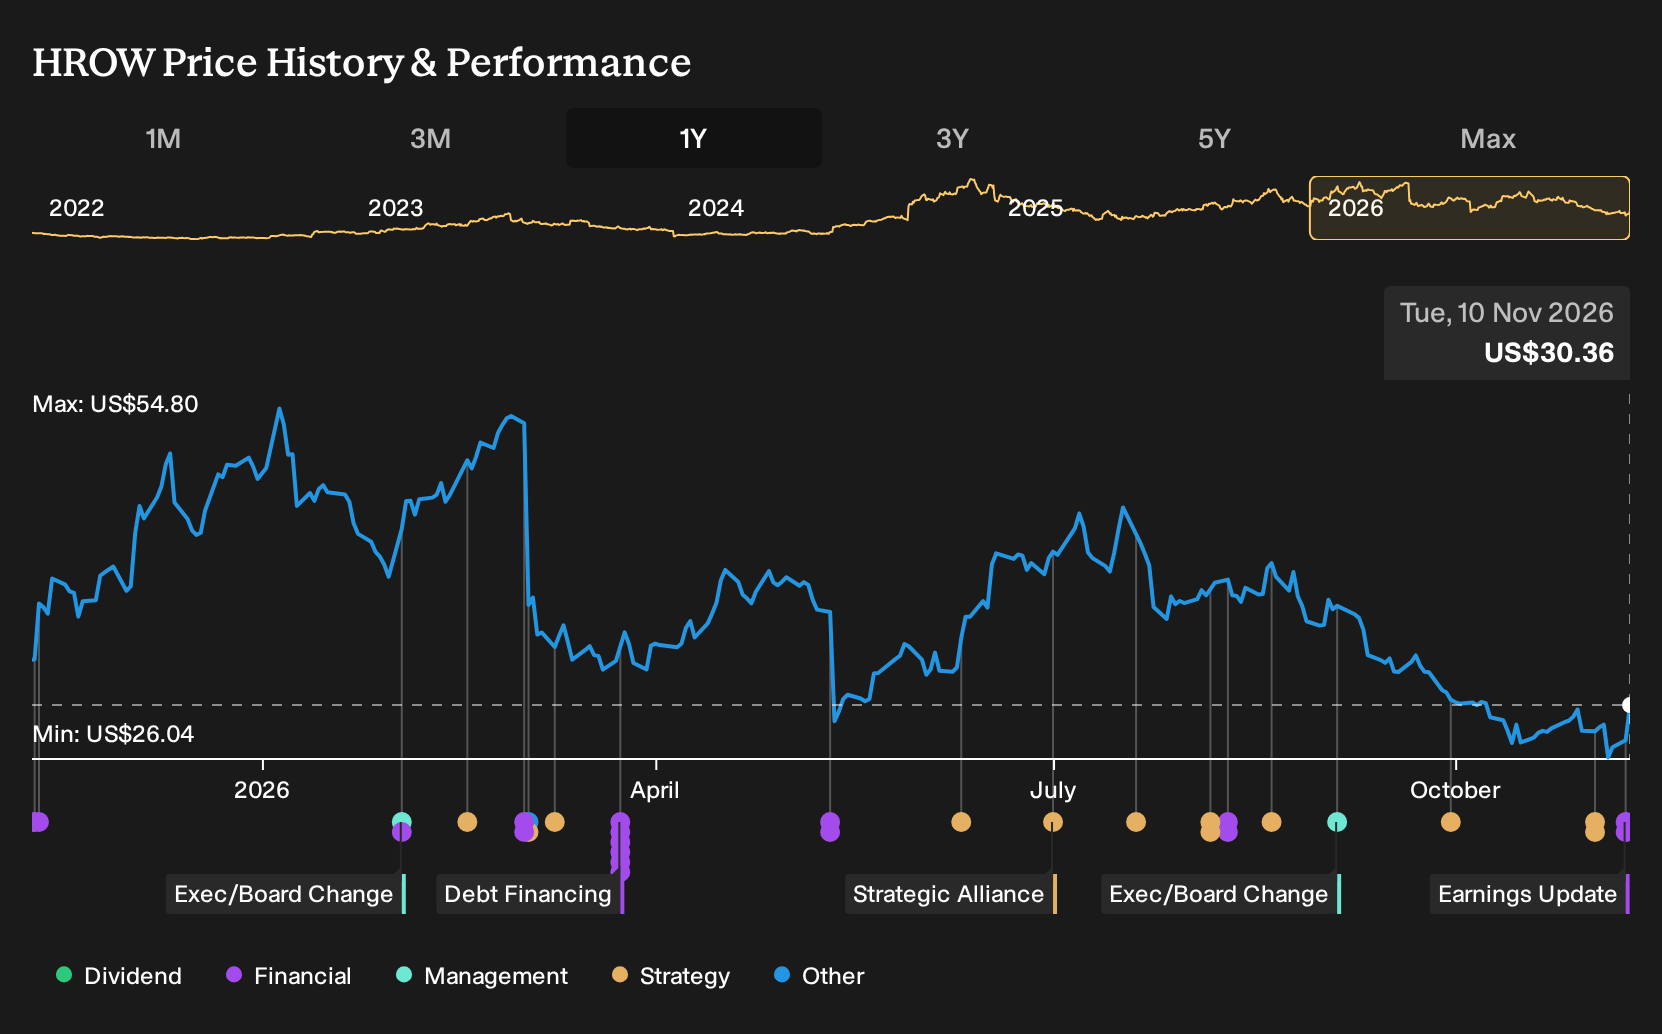
- Harrow reported third quarter 2026 revenue of US$99.3 million and net income of US$9.76 million, reaffirmed full year 2026 revenue guidance of US$350 million to US$365 million, and updated its adjusted EBITDA outlook, while also completing the TYRVAYA acquisition.
- The launch of HarrowRx and the TYRVAYA acquisition move Harrow further toward a scaled, multi product ophthalmic platform that connects prescribing, access, and an expanded branded portfolio into a single commercial engine.
- We will now look at how Harrow's record Q3 revenue and reaffirmed 2026 guidance reshape the broader investment narrative around execution.
Scan how Harrow’s latest quarter compares by lining up this earnings story against 20 high quality undiscovered gems with similar scale and fundamentals in adjacent sectors.
Harrow Investment Narrative Recap
To own Harrow, an investor needs to believe the branded ophthalmic platform can scale efficiently and that products like VEVYE, TRIESENCE, BYOOVIZ and TYRVAYA can support that build out. The record Q3 revenue of US$99.3 million and positive net income of US$9.76 million give that story more operational backing.
The short term catalyst remains execution against the reaffirmed 2026 revenue range of US$350 million to US$365 million after a lighter first half. The biggest risk is still concentration in a handful of brands, where any weaker prescription trends, reimbursement shifts, or pricing pressure could make that second half ramp harder to achieve.
The launch of HarrowRx looks tightly linked to these catalysts. By embedding Harrow’s portfolio in EMR workflows and routing prescriptions through a single point, the platform is designed to make it easier for practices to use and support branded products such as VEVYE and TYRVAYA across a larger patient base.
For shareholders watching the analyst consensus Narrative on Simply Wall St, HarrowRx sits right on the execution question. Better gross to net management and smoother access can help the business pursue its revenue guidance while trying to manage SG&A. The operational test is whether this infrastructure meaningfully supports prescription volumes across multiple franchises.
Harrow's narrative projects US$824.0 million of revenue and US$256.2 million of earnings by 2029, built on analysts' assumption of 44.1% yearly revenue growth and an earnings swing of roughly US$293.4 million from a loss of US$37.2 million today to the forecast consensus earnings figure.
Uncover why Harrow's fair value indicates a 108% potential upside to its current price. This suggests a discount that could close sooner than many expect.
Exploring Other Perspectives
For Harrow, the most optimistic analysts were already leaning hard into operating leverage before this earnings beat. They were pencilling in roughly US$946.8 million of revenue and US$306.2 million of earnings by 2029, far above consensus. You can read this quarter as a test of that bolder story, so it may be helpful to compare both views before deciding your own.
Explore 2 other Harrow fair value estimates, including one that suggests a potential upside of as much as 780% from the current price.
Reach Your Own Conclusion
Disagree with existing narratives? Extraordinary investment returns rarely come from following the herd, so trust your own instincts.
- A great starting point for your Harrow research is our analysis highlighting 3 key rewards that could impact your investment decision.
- See our latest analysis for Harrow. The report includes a comprehensive fundamental analysis summarized in a single visual, the Snowflake, making it easy to evaluate Harrow's overall financial health at a glance.
Looking for more Harrow sized investment ideas?
If Harrow has sharpened your thinking about scaled healthcare platforms, it can help to put that story beside other opportunities that share similar financial traits but sit in very different corners of the market.
The Simply Wall St Screener is built for exactly that kind of comparison, so you can pressure test your thesis across a broader set of businesses rather than focusing on a single stock.
- For investors who want quality first and price discipline second, scan a focused universe of companies on our 35 high quality undervalued stocks that combine stronger fundamentals with what may be more modest valuation multiples.
- If balance sheet strength is non negotiable for you, filter for businesses on the list of solid balance sheet and fundamentals (24 results) where leverage, liquidity, and asset coverage show a tighter financial profile.
- Those seeking ideas that sit off the beaten path can cast a wider net using the 10 elite penny stocks with strong financials to spot smaller companies that still meet your basic quality thresholds.
Have feedback on this article? Concerned about the content? Get in touch with us directly. Alternatively, email editorial-team@simplywallst.com