


Aflac (AFL) has drawn fresh attention after reporting third quarter 2026 results that showed lower revenue and net income than a year earlier, alongside a maintained dividend and an upcoming leadership change.
The recent quarterly results, the leadership succession plan at Aflac U.S. and the affirmed dividend have arrived alongside a 10.56% one-month share price return and a 14.88% year-to-date share price gain, while total shareholder return of 146.23% over five years indicates momentum that has built over time rather than faded.
Scan how Aflac compares with other insurers that pair earnings power with balance sheet strength using our hand picked list of solid balance sheet and fundamentals (24 results)
Aflac’s shares have already logged a strong run into weaker quarterly numbers and a steady dividend. The key tension now is whether most of the upside is behind the stock or still in front of it, as the valuation section sets out.
Most Popular Narrative: 7% Overvalued
Aflac closed at $126.64, while the analyst consensus Narrative on Simply Wall St anchors fair value at $118.53 using a 7.24% discount rate. This points to the stock trading modestly above that framework and puts more weight on the ingredients that sustain earnings than on rapid top line expansion.
The repositioning of about 5% of Aflac’s global investment portfolio, using foreign exchange gains on dollar assets to support moves out of older bonds, is expected to add over US$50 million of annual net investment income on a run rate basis. This directly supports earnings even if premium growth stays modest.
See why 47 investors see Aflac as 7% overvalued.
Result: Fair Value of $118.53 (OVERVALUED)
Still, pressure on Japan premiums and a higher benefit ratio near the top of guidance could unsettle confidence in Aflac’s earnings resilience narrative.
Find out about the key risks to this Aflac narrative.
Another View: Aflac Through The Cash Flow Lens
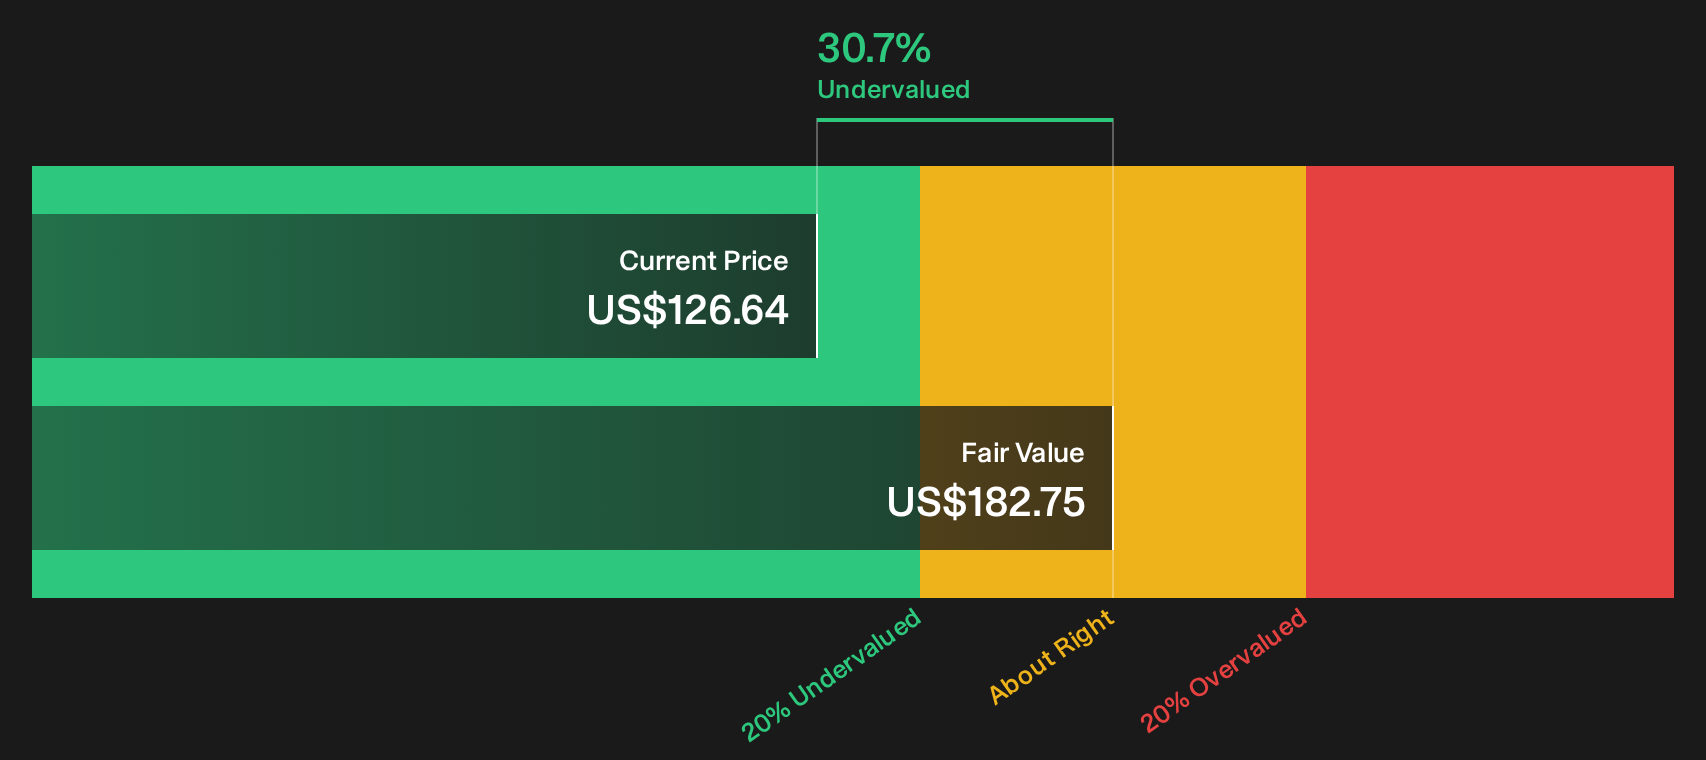
Analysts on Simply Wall St see Aflac as about 7% overvalued at $118.53 using their Narrative framework, yet the SWS DCF model points in the opposite direction. On that approach, Aflac trading at $126.64 is about 31% below an estimated future cash flow value of $182.75, which raises a simple question for investors: Which story do you trust more, the earnings multiple or the cash flow math?
To see how that cash flow estimate is built and what assumptions sit underneath it, Look into how the SWS DCF model arrives at its fair value.
Next Steps
Mixed signals like these rarely stay unresolved for long, so check the underlying data, stress test your own thesis, and weigh both sides of the story with the 2 key rewards and 1 important warning sign
Looking for more investment ideas beyond Aflac?
If Aflac has you thinking more carefully about price, quality and income, now is a good time to widen your search before the next opportunities move away.
Use these curated screens to quickly surface candidates that match different objectives.
- Target resilient balance sheets and consistent fundamentals by reviewing our list of solid balance sheet and fundamentals (24 results).
- Spot potential value opportunities ahead of the crowd with the 35 high quality undervalued stocks.
- Strengthen your income watchlist by scanning companies in the 5 dividend fortresses.
Have feedback on this article? Concerned about the content? Get in touch with us directly. Alternatively, email editorial-team@simplywallst.com