


Fresh sales data puts MonotaRO in focus
MonotaRO (TSE:3064) just released preliminary October sales of ¥32,749 million, up from ¥29,423 million a year earlier, alongside nine-month figures that showed higher sales, net income, and earnings per share.
Recent trading reflects that interest. MonotaRO's share price has climbed 7.13% over the past week and 28.99% over the last 90 days. The 1 year total shareholder return of 5.0% and 3 year total shareholder return of 60.35% point to stronger momentum over a longer stretch than in the year to date.
Scan beyond MonotaRO and see how other industrial suppliers are responding to similar momentum by reviewing our curated list of list of solid balance sheet and fundamentals (23 results)
After a 29% move in three months, MonotaRO has already rewarded recent buyers. The real puzzle now is whether that momentum reflects fair value or leaves more upside on the table.
Price-to-Earnings of 32x: Is it justified?
Valuation is where enthusiasm meets discipline. At a last close of ¥2,402.5, MonotaRO trades on a P/E of 32x, which places a rich price on each unit of reported earnings compared with peers.
The P/E ratio compares the share price to earnings per share. For a business like MonotaRO, which runs an online MRO platform, this measure links what investors pay today to the profits already being generated from its large product range and customer base.
Here is the tension for anyone looking at the ticker. MonotaRO is described as trading at 6.8% below an internal estimate of its future cash flow value, yet the same stock carries a P/E of 32x, which is far above the peer average of 9.1x and the JP Trade Distributors industry average of 10.2x. That implies the market is pricing in stronger earnings quality or durability than for typical distributors, and that the current earnings stream is valued much more aggressively than the estimated fair P/E of 18.4x suggests the market could move toward.
On a strict comparison, MonotaRO looks expensive. A 32x P/E is more than three times the sector average of 10.2x and sits well above the estimated fair P/E of 18.4x. This points to a valuation that leans heavily on continued profit growth and sustained high returns on equity rather than offering an obvious bargain.
Explore the SWS fair ratio for MonotaRO.
Result: Price-to-Earnings of 32x (OVERVALUED)
Still, the thesis around MonotaRO can quickly look fragile if earnings growth slows relative to its 32x P/E, or if competition pressures pricing on its MRO platform.
Find out about the key risks to this MonotaRO narrative.
Another view of MonotaRO's value
The P/E story paints MonotaRO as expensive, yet the SWS DCF model points in the opposite direction. At ¥2,402.5, the share price sits about 6.8% below an estimated future cash flow value of ¥2,576.96. One method flags pressure; the other hints at a cushion. Which lens do you trust more right now?
Look into how the SWS DCF model arrives at its fair value.
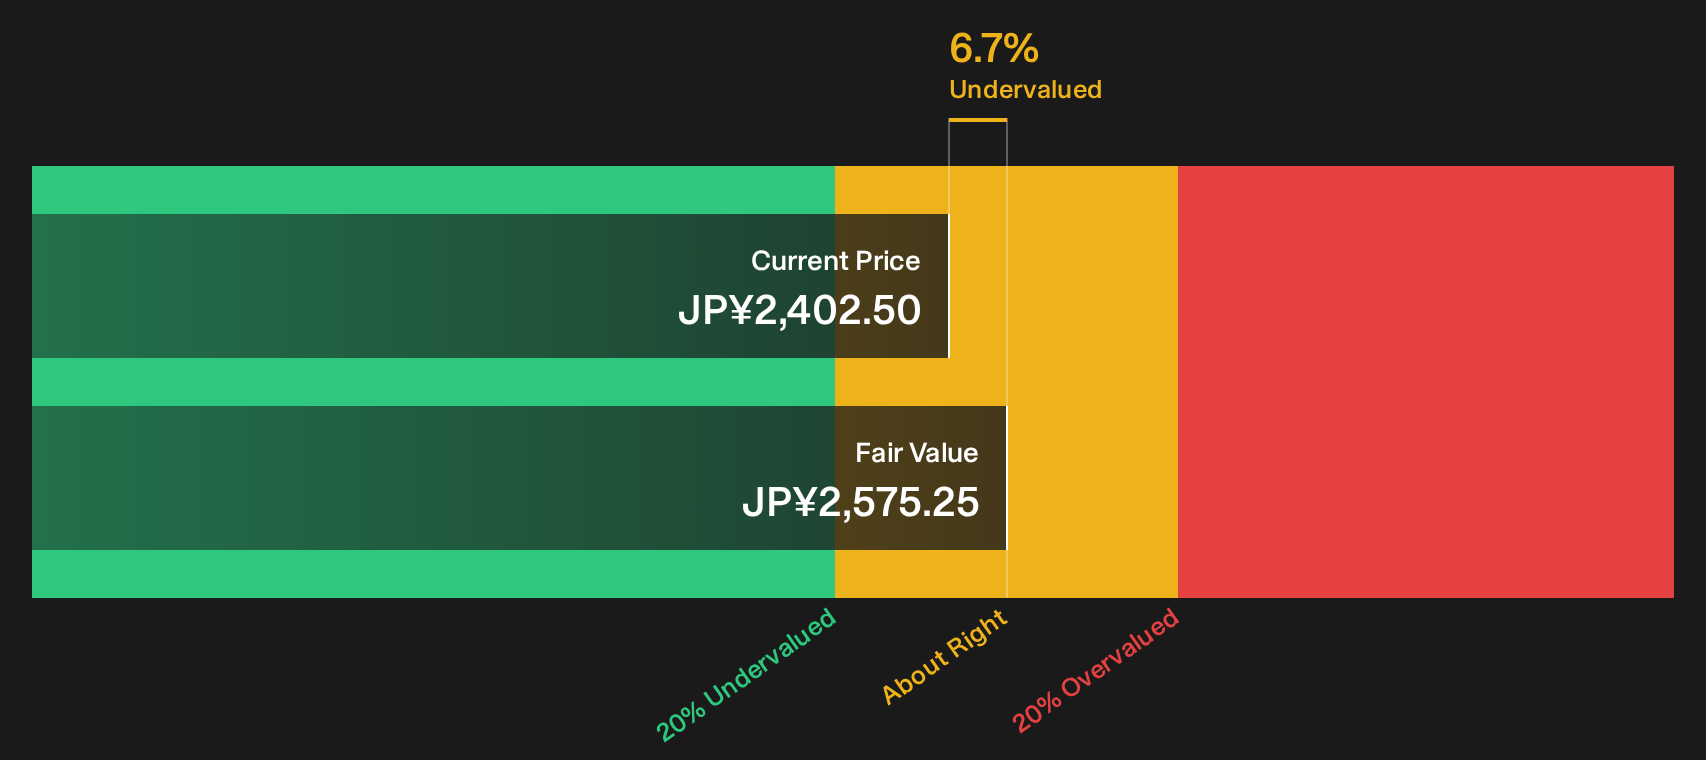
Simply Wall St performs a discounted cash flow (DCF) on every stock in the world every day (check out MonotaRO for example). We show the entire calculation in full. You can track the result in your watchlist or portfolio and be alerted when this changes, or use our stock screener to discover 24 high quality undervalued stocks. If you save a screener we even alert you when new companies match - so you never miss a potential opportunity.
Next Steps
Mixed signals around MonotaRO's valuation can either look like opportunity or noise, depending on how you read the data. If you want to move quickly from headline impressions to your own evidence based view, start by weighing the 3 key rewards
Looking for more investment ideas beyond MonotaRO?
If MonotaRO has sharpened your appetite for data driven opportunities, do not stop here. Use the Simply Wall Street screener to widen your field and pressure test fresh ideas.
- Target resilient compounding potential by reviewing a carefully filtered mix of quality and value through the 24 high quality undervalued stocks
- Prioritise capital preservation and steadier ride potential by focusing on companies with resilient metrics using the 19 resilient stocks with low risk scores
- Hunt for underfollowed potential before the crowd catches on by scanning the 72 high quality undiscovered gems
Have feedback on this article? Concerned about the content? Get in touch with us directly. Alternatively, email editorial-team@simplywallst.com