


Guardant Health (GH) is back in focus after a cluster of fresh catalysts, including new colorectal cancer data from its PRECISION study, regulatory approval in Taiwan for Guardant360 Tissue, and a revenue beat accompanied by raised guidance for 2026.
Guardant Health shares trade at US$154.83 and have pulled back in the very short term, with the 7 day share price return down 8.16% and the 30 day move down 4.89%. At the same time, the year to date share price return sits at 52.18% and the 1 year total shareholder return is 58.25%, suggesting momentum over the past year remains strong despite recent volatility around earnings, fresh clinical data and overseas product approvals.
Scan other oncology and diagnostics players showing similar momentum and research catalysts with the hand picked 36 healthcare AI stocks that align with Guardant Health's precision medicine story.
Bulls see Guardant Health’s pullback as a chance to pay less for faster growing oncology revenue. Bears point to steep losses and patent risk. Which story do the current valuation markers lean toward?
Most Popular Narrative: 23% Undervalued
Guardant Health’s last close at $154.83 sits below the $202.24 fair value from the analyst consensus Narrative on Simply Wall St. This gap is anchored to screening growth, oncology volumes and legal headwinds.
A key factor is whether Guardant Health can translate current test volume trends, changes in Shield cost per test, and developments in reimbursement into sustainable cash generation while managing the impact of patent royalties and ongoing investment.
See why 24 investors see Guardant Health as 23% undervalued.
Result: Fair Value of $202.24 (UNDERVALUED)
Still, the patent damages and 6% royalty through 2033, combined with the guided free cash flow burn of about US$195 million to US$205 million in 2026, could pressure Guardant Health’s bullish narrative.
Find out about the key risks to this Guardant Health narrative.
Another View: Guardant Health Looks Expensive On Sales
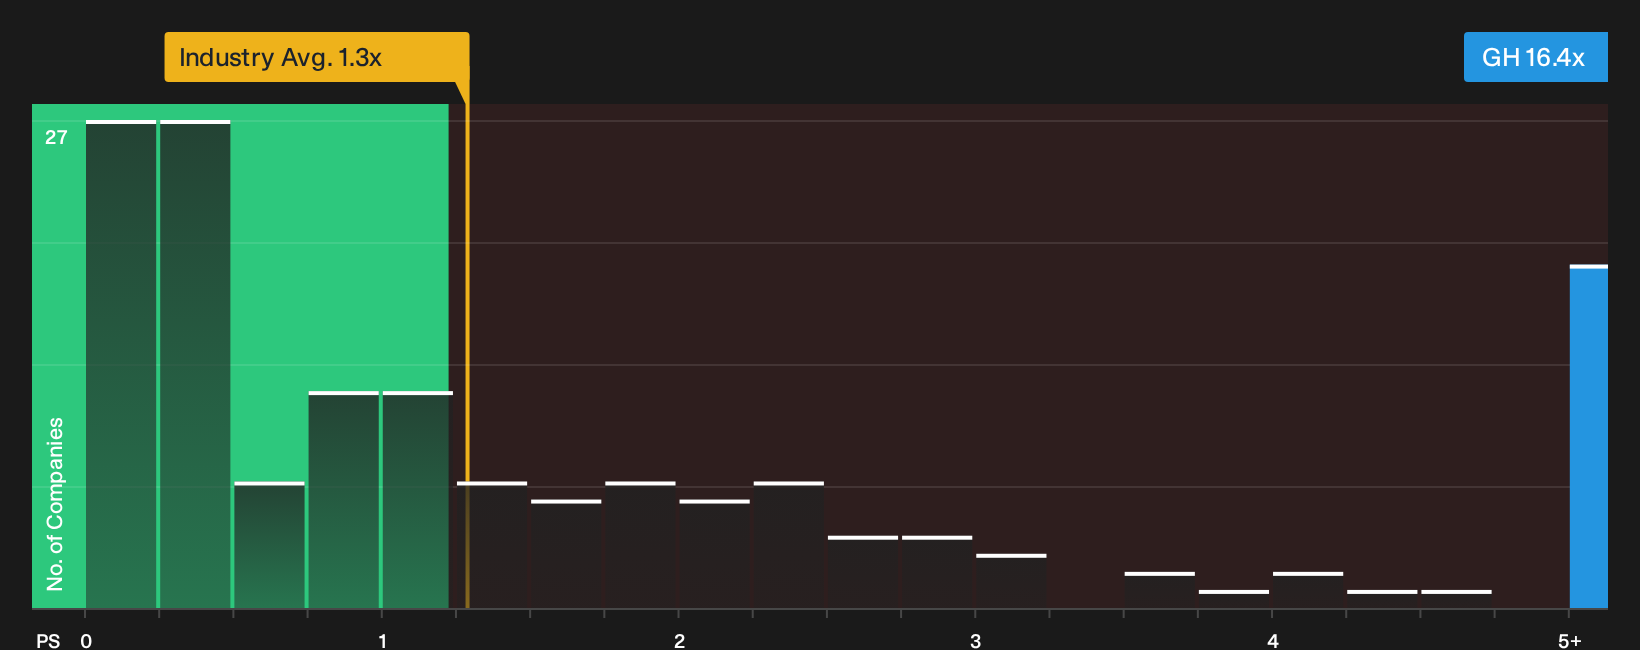
Guardant Health may screen as undervalued on fair value estimates, yet its current P/S ratio of 16.4x is far above the estimated fair ratio of 10.2x, the US Healthcare sector at 1.2x, and peers at 4.5x. That gap points to real valuation risk if growth or cash generation fall short.
For a closer look at how these sales based metrics stack up against the broader market, take a look at the See what the numbers say about this price — find out in our valuation breakdown.
Next Steps
Mixed signals like these often split opinion on Guardant Health, so move quickly, review the full data set and weigh the 3 key rewards and 2 important warning signs
Looking for more investment ideas beyond Guardant Health?
Do not stop at Guardant Health. Use the tools already built for you and prepare a wider watchlist before the next wave of opportunities passes by.
- Explore potential upside by scanning companies that combine quality with attractive pricing through the 36 high quality undervalued stocks.
- Prioritise resilience by focusing on businesses with stronger finances via the list of solid balance sheet and fundamentals (24 results).
- Look for lesser-known opportunities by checking the 20 high quality undiscovered gems before they gain wider attention.
Have feedback on this article? Concerned about the content? Get in touch with us directly. Alternatively, email editorial-team@simplywallst.com