


Rengo stock: earnings beat and guidance revision reshape expectations
Rengo (TSE:3941) reported stronger half-year results alongside an upgraded six-month outlook, supported by price increases in its Flexible Packaging business and heightened packaging demand linked to Middle East geopolitical risks.
Recent trading around ¥1,520.5 reflects mixed momentum for Rengo, with the share price return easing over the past quarter, even as the year-to-date share price return of 24.12% and 1-year total shareholder return of 56.32% point to a stronger longer-term run, supported by upgraded guidance and the latest half-year earnings beat.
Scan other packaging and materials stocks that show similar earnings momentum and pricing power using our curated 24 high quality undervalued stocks.
Rengo shares have already delivered strong 1-year gains, yet the stock still trades below both intrinsic and analyst estimates. Following this earnings beat and guidance lift, does the risk reward still lean toward buyers, or does it now appear more balanced?
Preferred P/E of 11.8x: Is it justified?
At a last close of ¥1,520.5 and a P/E of 11.8x, Rengo trades at a higher earnings multiple than the broader JP Packaging sector, even though the stock screens as good value against some benchmarks and not as cheap against others.
The P/E ratio compares the share price to earnings per share. For a packaging producer like Rengo, it gives a quick read on how much investors are paying for each unit of profit in a segment where demand is often steady but growth tends to be modest.
Rengo is described as expensive against the JP Packaging industry average P/E of 8.7x, which points to investors assigning a richer earnings tag than they do to sector peers. Yet the same 11.8x multiple is flagged as good value both against an estimated fair P/E of 13.3x and a peer group average of 14x, suggesting the premium versus the industry could reflect company specific drivers such as its recent earnings beat and 45.9% profit growth over the past year.
On these cross checks, the valuation gap versus the industry is strong, and the fair ratio signals a level the market could still move towards if current expectations hold.
Explore the SWS fair ratio for Rengo.
Result: Price-to-earnings of 11.8x (UNDERVALUED)
Still, revenue growth of 2.19% and net income growth of 4.72% rely heavily on packaging demand and pricing, which could soften if geopolitical or input cost pressures shift.
Find out about the key risks to this Rengo narrative.
Another view on Rengo valuation
The P/E suggests Rengo carries a premium tag, yet the SWS DCF model points the other way. On that framework, the estimated future cash flow value sits around ¥2,075.67 per share, compared with the current ¥1,520.5 level, which screens as undervalued. Which signal is more relevant for assessing the next move?
Look into how the SWS DCF model arrives at its fair value.
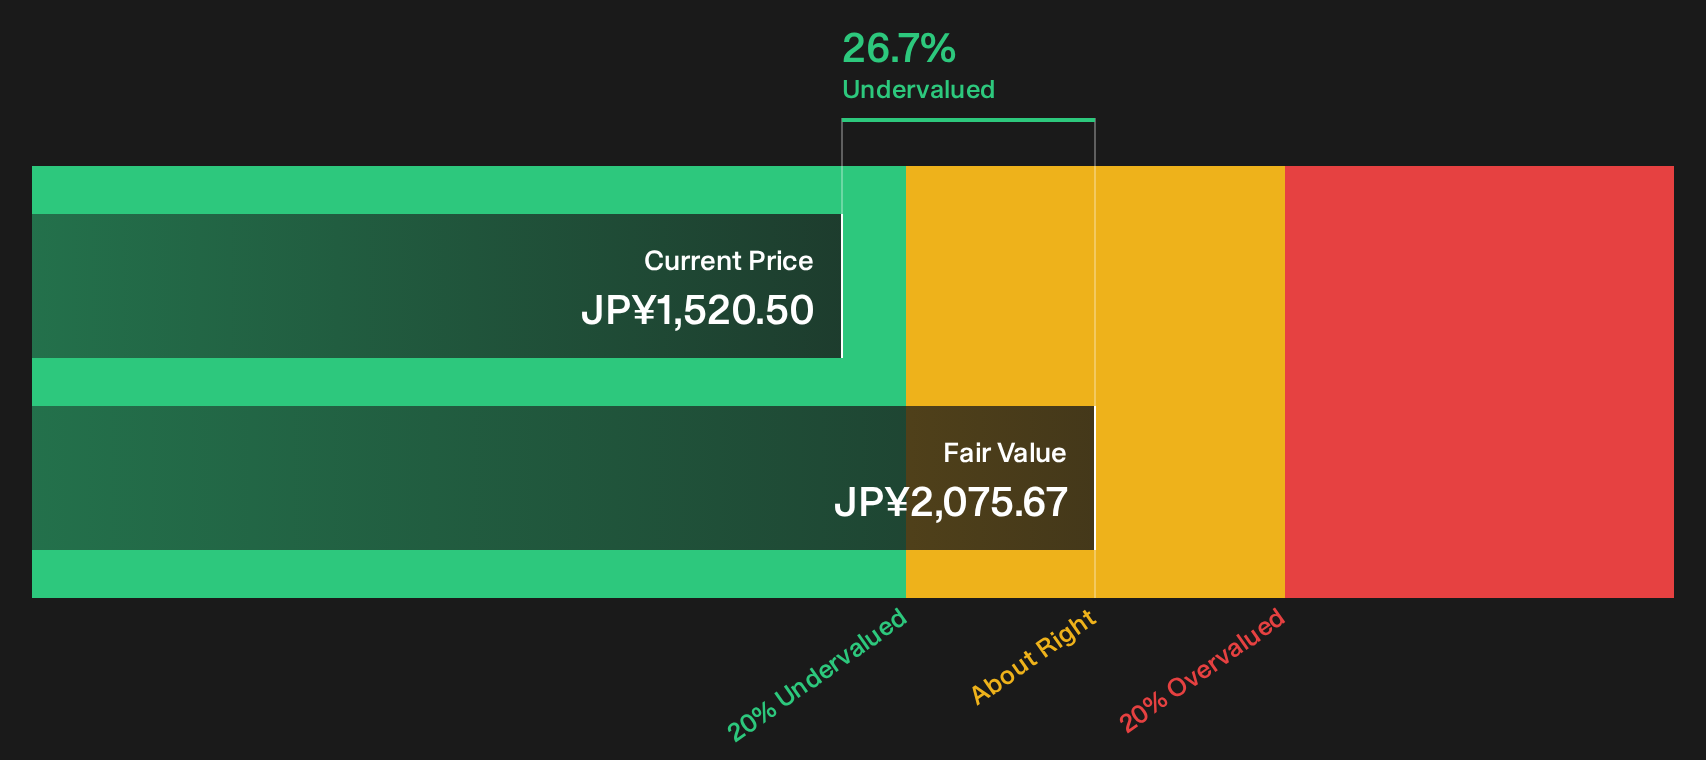
Simply Wall St performs a discounted cash flow (DCF) on every stock in the world every day (check out Rengo for example). We show the entire calculation in full. You can track the result in your watchlist or portfolio and be alerted when this changes, or use our stock screener to discover 24 high quality undervalued stocks. If you save a screener we even alert you when new companies match - so you never miss a potential opportunity.
Next Steps
With mixed signals on value and expectations around Rengo, you do not need to rely on anyone else's conclusion. Act while the details are fresh, and weigh both sides of the story by checking the 3 key rewards and 2 important warning signs.
Looking for more investment ideas beyond Rengo?
If Rengo has sharpened your focus, use that momentum. The right watchlist today can shape the opportunities you are ready for tomorrow.
- Target resilient compounding potential by scanning companies that look mispriced on fundamentals through our 24 high quality undervalued stocks.
- Build a sturdier core portfolio by focusing on balance sheet strength and solid financial footing using the list of solid balance sheet and fundamentals (23 results).
- Hunt for under-followed opportunities with strong fundamentals before the crowd catches on by checking the 72 high quality undiscovered gems.
Have feedback on this article? Concerned about the content? Get in touch with us directly. Alternatively, email editorial-team@simplywallst.com