


Calumet (CLMT) moved back into focus after third quarter results on 6 November 2026, as higher sales coincided with lower quarterly profit and a loss across the first nine months of the year.
That mixed earnings update has come after a sharp swing in Calumet’s share price. The stock is down 37.2% on a 30 day share price return and 26.4% on a 90 day share price return, even though the year to date share price return is 83.6% and the 1 year total shareholder return is 89.7%. This points to strong longer term gains but fading recent momentum as investors reassess the balance between sales growth and the nine month loss.
Scan how Calumet’s recent swing compares with other energy-related plays by reviewing the hand picked 32 high quality undervalued stocks that currently combine quality fundamentals with marked share price weakness.
Calumet’s slide after strong one year gains puts a spotlight on whether the price now tracks the nine month loss and earnings wobble, or simply swings with changing sentiment. That is where valuation work starts to matter.
Most Popular Narrative: 36% Undervalued
Calumet closed at $35.90, while the analyst consensus Narrative on Simply Wall St anchors fair value at $55.80. This implies a sizable valuation gap that frames how investors may read the latest earnings wobble and nine month loss.
The MaxSAF 150 project is on track to start up in the first half of 2026, enabling Calumet to produce 120-150 million annual gallons of sustainable aviation fuel (SAF) at relatively low capital costs, capturing premiums of $1-$2/gallon over renewable diesel and tapping into surging mandated and voluntary SAF demand globally; this is likely to drive material step-up in revenues and EBITDA margin expansion once operational.
See why 5 investors see Calumet as 36% undervalued.
The analyst work behind that fair value rests on a discount rate of 7.35%, a revenue growth assumption of 5.98%, an expected net margin of about 10.1% and a future P/E of 11.48x applied to forecast earnings.
Analysts also flag that their $55.80 target is part of a wide range, with estimates spanning from $40.00 to $75.00. This underlines how sensitive the outcome is to views on renewable fuel economics, regulatory support and Calumet’s ability to move from its current loss of $193.8 million to sustained profitability.
For readers weighing that gap between the share price and the Narrative fair value, the key questions are whether those long term margin and earnings expectations feel realistic, and how comfortable you are with Calumet’s leverage and exposure to shifting policy on renewable credits.
Result: Fair Value of $55.80 (UNDERVALUED)
Still, Calumet’s reliance on supportive renewable fuel policy and its substantial debt load could quickly challenge that 36% undervalued Narrative if either of these factors moves against it.
Find out about the key risks to this Calumet narrative.
Another View: What Multiples Say About Calumet
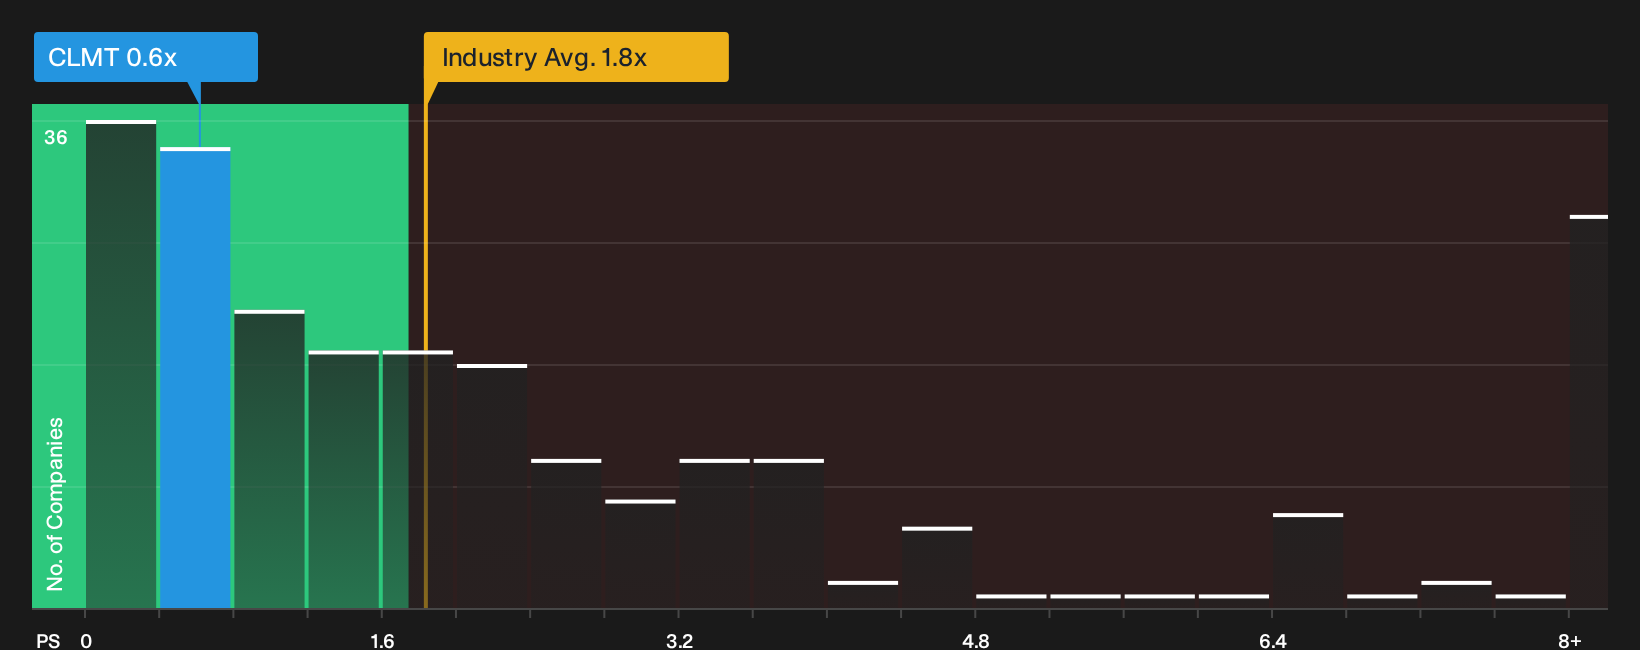
That 36% undervalued narrative sits beside a very different signal from simple sales multiples. Calumet trades on a P/S of 0.6x, which matches its fair ratio of 0.6x and is double the 0.3x peer average, even while sitting far below the broader US Oil and Gas group at 1.8x. Does that look like a margin of safety, or a premium on a loss-making refinery and renewables operator, to you?
For a cleaner read on how the numbers stack up against this sales-based view, See what the numbers say about this price — find out in our valuation breakdown.
Next Steps
Big valuation gaps and mixed earnings can make Calumet feel urgent. Act while sentiment is still shifting and weigh both sides of the story through 2 key rewards and 1 important warning sign
Looking for more Calumet sized investment ideas?
Do not stop your research with Calumet alone. Fresh ideas often come from comparing it against other opportunities that match your risk appetite and time horizon.
- Target potential mispricing by hunting for quality companies trading on weaker sentiment through the 32 high quality undervalued stocks.
- Prioritise resilience and sleep better at night by focusing on companies with strong finances using the list of solid balance sheet and fundamentals (24 results).
- Build a watchlist of income ideas by filtering for stocks that offer robust payouts through the 6 dividend fortresses.
Have feedback on this article? Concerned about the content? Get in touch with us directly. Alternatively, email editorial-team@simplywallst.com