


Franco-Nevada (TSX:FNV) just released its latest third quarter earnings, providing an updated snapshot of how its royalty-focused precious metals and energy portfolio is translating into sales, profit and dividends at this time.
Franco-Nevada shares closed at CA$354.26, and the stock has climbed with a 23.82% year to date share price return along with a 27.40% one year total shareholder return, a combination that points to building momentum as investors react to stronger earnings, portfolio updates and the recent dividend declaration.
See how Franco-Nevada's royalty model compares with other precious metals producers by reviewing the hand picked 33 elite gold producer stocks now benefiting from stronger commodity pricing and earnings momentum.
The recent surge in Franco-Nevada sharpens the question. Is this royalty giant still pricing in meaningful upside, or have investors already paid up for the earnings rebound and dividend strength that just showed up in the numbers?
Most Popular Narrative: 11% Undervalued
Franco-Nevada's last close at CA$354.26 sits below the analyst consensus Narrative fair value of CA$398.68. This points to a valuation gap that the analyst consensus Narrative on Simply Wall St links directly to the depth of its royalty portfolio and long-life asset optionality.
Expansion of Franco-Nevada’s large, diversified royalty and streaming portfolio, including the 441-asset footprint with 121 producing assets and additional projects that could add around 220,000 GEOs annually, creates multi-decade optionality that can feed into revenue and earnings beyond current guidance.
See why 53 investors see Franco-Nevada as 11% undervalued.
Result: Fair Value of CA$398.68 (UNDERVALUED)
Still, the narrative can break if gold prices weaken for an extended stretch or if issues at assets such as Cobre Panamá disrupt expected royalty volumes.
Find out about the key risks to this Franco-Nevada narrative.
Another View: Franco-Nevada Looks Expensive On Earnings
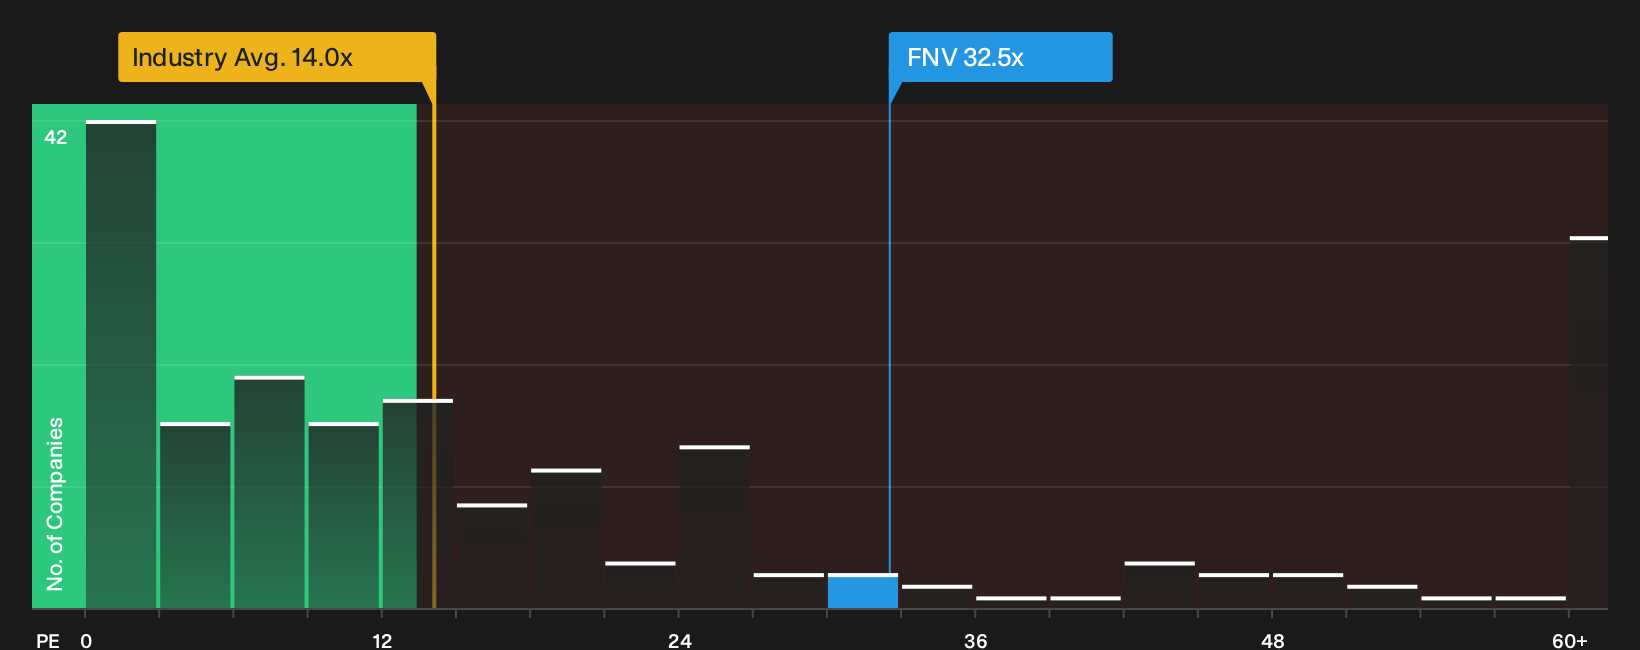
Franco-Nevada might appear undervalued against the analyst fair value, but the P/E of 32.4x sends a different signal. The Canadian Metals and Mining industry averages 14x, peers sit near 14.3x, and the fair ratio is 16.8x. That premium raises a simple question: how much optimism are you really paying for?
To see how those earnings multiples stack up in more detail, including the gap to the fair ratio the market could move toward, See what the numbers say about this price — find out in our valuation breakdown.
Next Steps
Sentiment in this Franco-Nevada update may feel mixed, so pressure test the data yourself and decide how compelling the setup really is. To see what optimism is already reflected in the underlying thesis, review the 2 key rewards
Looking for more Franco-Nevada style investment ideas?
Franco-Nevada gives you one angle on quality and income. Use the Simply Wall St Screener to compare different approaches and pressure test your own watchlist.
- Target dependable income streams by checking companies in the 3 dividend fortresses that may offer higher yields backed by solid cash generation.
- Hunt for potential value opportunities through the 5 high quality undervalued stocks that combine quality fundamentals with prices that sit below their estimated worth.
- Prioritise resilience first and filter for stability with the 9 resilient stocks with low risk scores so you are not relying on just one stock to manage volatility.
Have feedback on this article? Concerned about the content? Get in touch with us directly. Alternatively, email editorial-team@simplywallst.com