


Tsubakimoto Chain (TSE:6371) has investors’ attention after half year sales reached ¥174,131 million with net income of ¥10,215 million, alongside updated full year guidance and an affirmed interim dividend of ¥40 per share.
Tsubakimoto Chain’s recent earnings update and confirmed interim dividend come after a solid run, with the share price at ¥2,642 and a year-to-date share price return of 13.93%, supported by a 27.03% 1-year total shareholder return and a 211.91% 5-year total shareholder return.
Scan how Tsubakimoto Chain compares with other industrial names riding earnings momentum and disciplined balance sheets using our hand picked list of solid balance sheet and fundamentals (23 results)
Tsubakimoto Chain now pairs a long operating history with a share price that has already delivered strong multi year returns. After this latest move and updated guidance, does the valuation still leave enough on the table?
Preferred Price-to-Earnings of 8.9x: Is it justified?
Tsubakimoto Chain trades on a P/E of 8.9x, while the SWS DCF model points to a future cash flow value of ¥4,706.96 per share against a last close of ¥2,642. That combination suggests the market price sits well below the internal valuation framework used here.
The P/E ratio compares what investors currently pay for each yen of earnings to what similar firms command. For an industrial manufacturer with a long operating history and steady profitability, this yardstick helps you see whether earnings are being priced at a discount or a premium to peers that share similar business models and capital intensity.
On that score, Tsubakimoto Chain looks inexpensive. The P/E of 8.9x is below both the peer average of 12.7x and the JP Machinery industry average of 12x, which points to a sizeable gap in how the market values its profits compared with comparable businesses. The estimated fair P/E of 11.5x also sits well above the current multiple, a level the ratio could move towards if sentiment and assumptions around future earnings align more closely with that fair value framework.
Explore the SWS fair ratio for Tsubakimoto Chain.
Result: Price-to-Earnings of 8.9x (UNDERVALUED)
Still, the valuation case around Tsubakimoto Chain can weaken quickly if earnings expectations are revised lower or if broader market sentiment toward machinery stocks cools.
Find out about the key risks to this Tsubakimoto Chain narrative.
Another view on Tsubakimoto Chain’s value
The SWS DCF model cross checks that cheap P/E story. It values Tsubakimoto Chain’s future cash flows at ¥4,706.96 per share, compared with the current ¥2,642 price, which still points to an undervalued stock. If both tools agree, what risk could upset that picture for you as a shareholder?
Look into how the SWS DCF model arrives at its fair value.
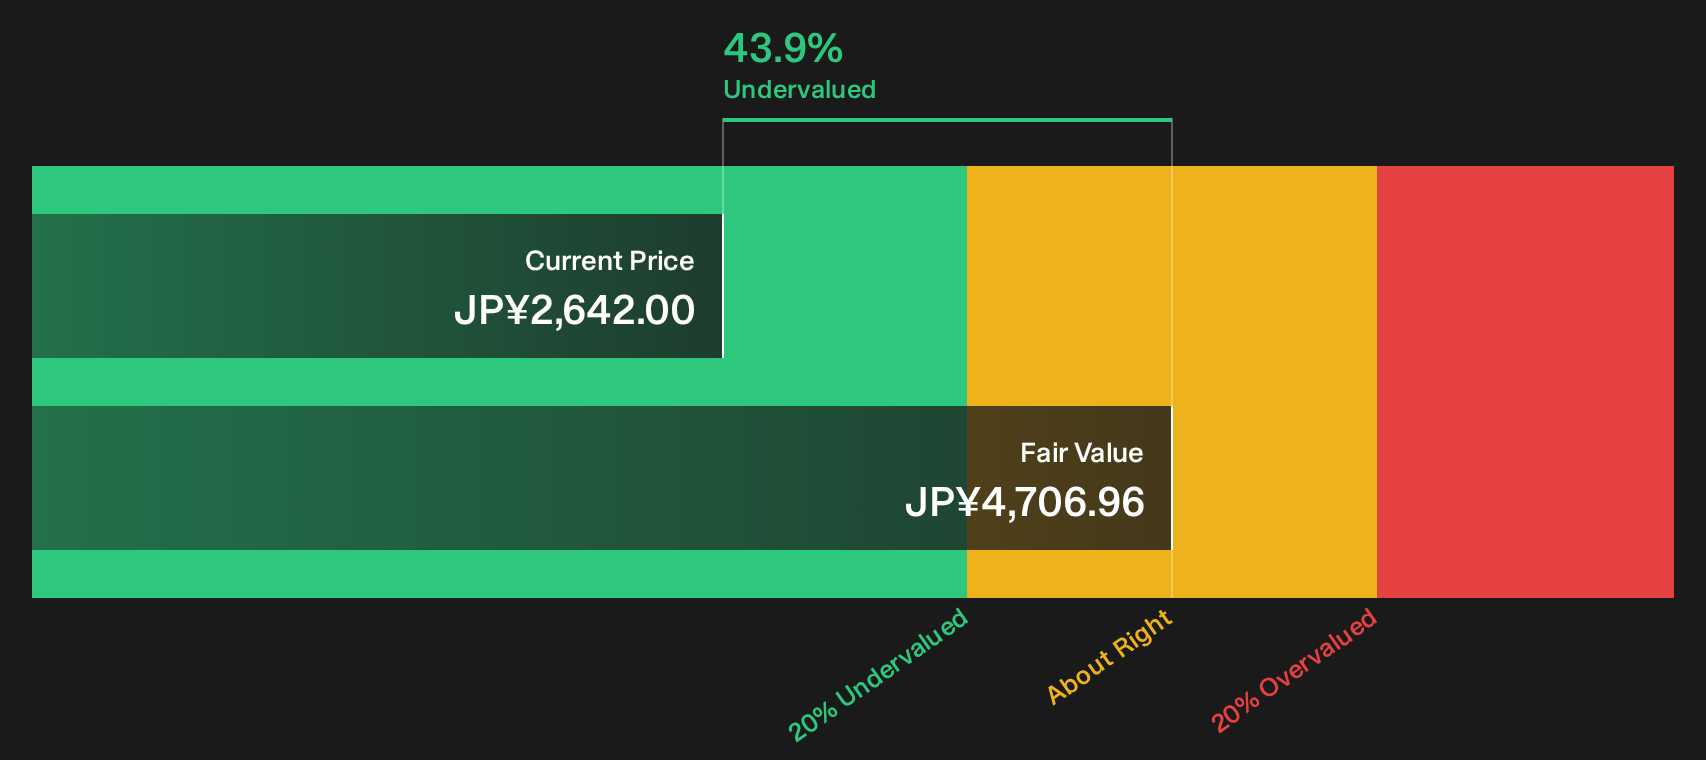
Simply Wall St performs a discounted cash flow (DCF) on every stock in the world every day (check out Tsubakimoto Chain for example). We show the entire calculation in full. You can track the result in your watchlist or portfolio and be alerted when this changes, or use our stock screener to discover 24 high quality undervalued stocks. If you save a screener we even alert you when new companies match - so you never miss a potential opportunity.
Next Steps
If this mix of upside and risk around Tsubakimoto Chain feels finely balanced, consider acting promptly, study the details for yourself, and weigh both sides of the story. To see the full breakdown of key positives and the main concern flagged by the market, start with the 4 key rewards and 1 important warning sign
Looking for more investment ideas beyond Tsubakimoto Chain?
If Tsubakimoto Chain is on your radar, do not stop there. Use targeted screeners to quickly surface other opportunities that match the kind of edge you want.
- Target resilient candidates that aim to preserve capital first and growth second by scanning a curated set of 19 resilient stocks with low risk scores.
- Hunt for quality businesses that trade at what may be discounted valuations by working through a focused group of 24 high quality undervalued stocks.
- Zero in on underfollowed opportunities with robust fundamentals by reviewing a carefully filtered pool of 72 high quality undiscovered gems.
Have feedback on this article? Concerned about the content? Get in touch with us directly. Alternatively, email editorial-team@simplywallst.com