


Karman Holdings has bounced hard in the short term, yet the stock is still down sharply for the year, which puts a spotlight on whether the current share price lines up with what its earnings can support. With the business tied to space and defense programs that often play out over long contracts, the question is how much of that earnings power the market is already pricing in today.
- The share price has fallen 41.8% year to date, so any rebound now puts real pressure on the earnings story to justify a higher base.
- Recent record revenue and the acquisition of Walker Precision may support expectations for stronger future profit generation, which feeds directly into how investors think about the stock's earnings value.
- The analysts covering Karman Holdings have run their own numbers. See what analysts think Karman Holdings's shares could be worth.
The issue now is whether Karman Holdings' latest share price meaningfully reflects the earnings it is currently generating and what those earnings suggest under a Fair Ratio lens.
If you are weighing whether Karman Holdings' rebound lines up with its earnings story, it can help to compare it with other 32 high quality undervalued stocks.
Does Karman Holdings Look Pricey on Earnings?
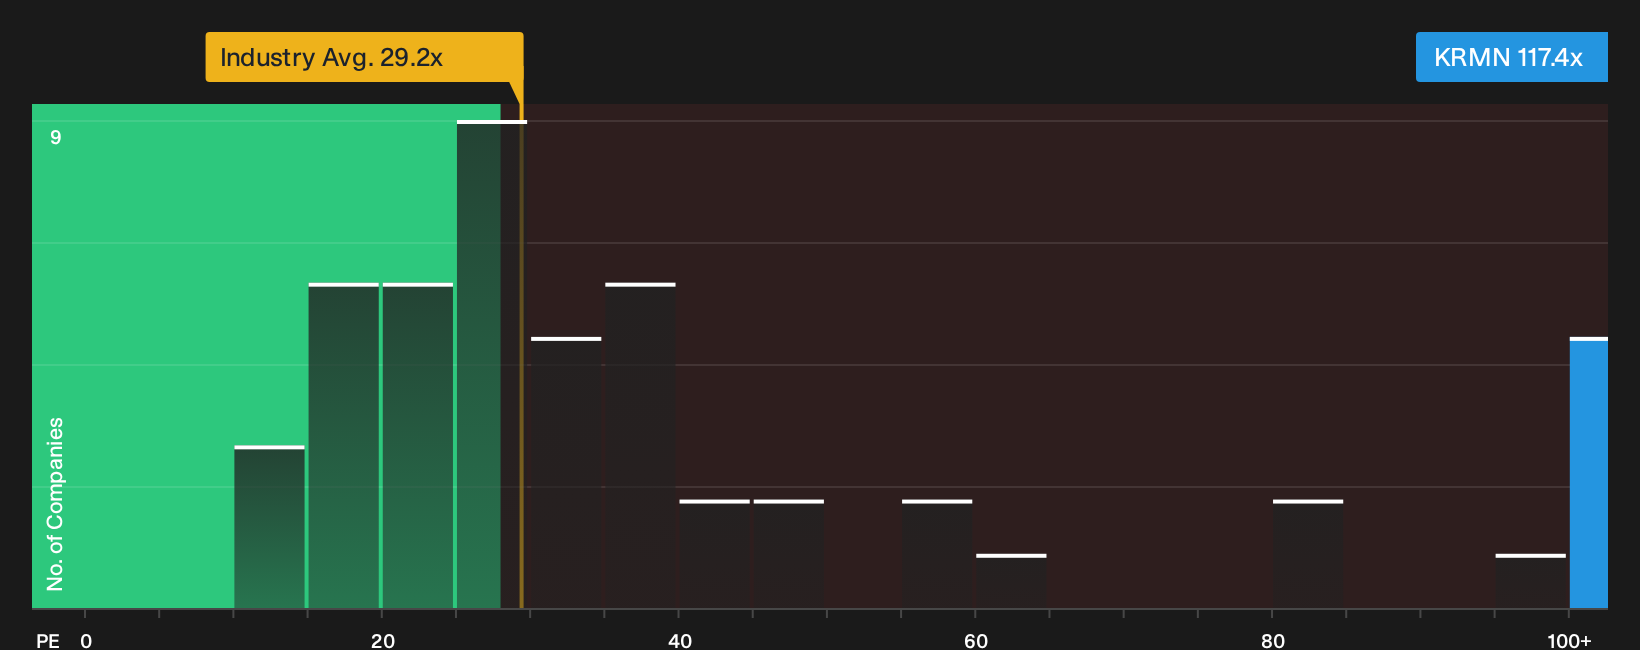
The P/E ratio suits Karman Holdings because earnings sit at the center of how investors judge contract driven defense businesses. Karman trades on a P/E of 117.4x, which is roughly double the 57.7x peer average and far above the wider Aerospace & Defense sector on 29.2x. That gap signals that the share price already embeds a strong view on the earnings profile rather than a simple sector level read across.
Because the Fair Ratio framework blends Karman Holdings' growth expectations, profitability, size and risk profile into a tailored benchmark, the current multiple screens as overvalued against that yardstick. Despite record revenue and the Walker Precision acquisition supporting the story, the market is assigning a richer P/E than both sector and peer references, so any holding thesis needs to lean heavily on the durability and conversion of that earnings stream. Explore the numbers behind Karman Holdings's P/E valuation.
The Karman Holdings Narrative: What Would Justify Today's Price?
Simply Wall St Narratives pick up where the Karman Holdings valuation puzzle leaves off. They spell out which assumptions on growth, margins and earnings would need to hold for the stock to be worth materially more or materially less than today’s price, and they sit on the company’s Community page. Each idea frames Karman Holdings' fair value as a thesis about the business that can be revisited over time, rather than a one off snapshot.
Bulls and bears are looking at the same Karman Holdings earnings engine and coming away with very different views on what the current price already reflects.
Bull case: 58% undervalued
According to FundamentalFlow, an investor in the Simply Wall St Community, the disconnect starts with how Karman Holdings has traded versus its operating results.
"By January 2026, it was trading at $118. Today, it's at $49.50, yet the underlying business just posted its best quarter in company history…"
Discover why this Narrative puts Karman Holdings at 58% undervalued.
Bear case: 6% overvalued
The bearish analyst Narrative on Simply Wall St focuses on whether Karman Holdings can turn headline wins into lasting balance sheet strength.
"Bearish analysts expect Karman Holdings to struggle under its leveraged balance sheet and working capital needs, leaving it exposed if growth or margins fall short…"
Explore why this Narrative puts Karman Holdings at 6% overvalued.
The share price is only one piece of the Karman Holdings puzzle
Valuation tells you what Karman Holdings costs today, but the analyst view on where earnings and cash flows might land a few years from now offers a different reference point for your decision. Explore where analysts expect Karman Holdings to be in a few years.
Have feedback on this article? Concerned about the content? Get in touch with us directly. Alternatively, email editorial-team@simplywallst.com