


CorVel (CRVL) is back in focus after reporting second quarter 2026 results that show higher sales, net income, and earnings per share compared with the same period a year earlier.
CorVel’s recent update landed against a backdrop where the share price has climbed 27.98% over the past 90 days and 27.96% year to date, while the 1-year total shareholder return of 14.43% points to steadier, longer term compounding that investors are weighing against the latest earnings strength.
Scan how CorVel’s momentum compares with other companies delivering strong earnings shifts using our curated list of 19 high quality undiscovered gems for a broader set of ideas.
Bulls point to CorVel’s stronger recent earnings and share price climb. Bears question whether that surge already prices in the good news. The valuation work now shows which side current numbers lean toward.
Price-to-Earnings of 34.9x: Is it justified?
CorVel’s share price of $84.12 trades on a P/E of 34.9x, which sits below its peer group average yet above the wider US Healthcare sector’s level. The market is clearly paying up for its earnings profile, but not at the highest end of available options.
The P/E ratio compares what investors are willing to pay today for each dollar of current profit. For a services focused healthcare specialist like CorVel, which reports net income of $121.5m on $1.01b of revenue, that earnings-based yardstick tends to matter more than sales-based or asset-based measures.
Compared with direct peers on a 49.2x average P/E, CorVel trades at a clear discount. This suggests the broader group is priced more aggressively for profit potential than this stock. Against the US Healthcare industry average P/E of 25.1x, CorVel instead screens as expensive, implying the wider sector is valued more conservatively while this business sits closer to the premium end of the range.
See what the numbers say about this price — find out in our valuation breakdown.
Result: Price-to-Earnings of 34.9x (ABOUT RIGHT)
Still, CorVel’s dependence on workers’ compensation and liability claims volumes, along with a P/E premium to the broader US Healthcare sector, could unwind if customers rein in spending.
Find out about the key risks to this CorVel narrative.
Another View: CorVel Through a Cash Flow Lens
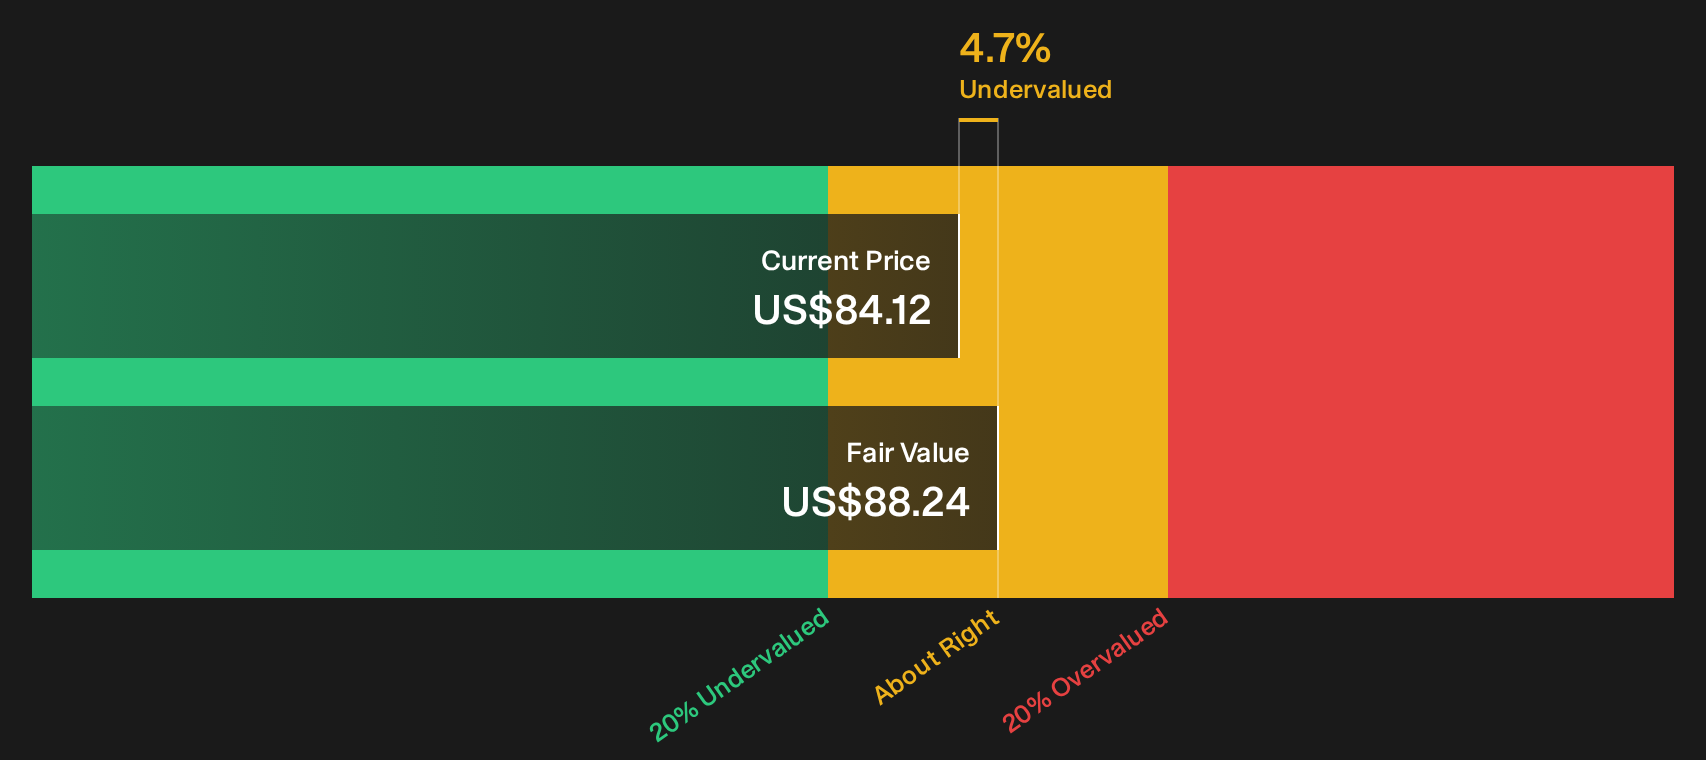
The P/E work presents CorVel as roughly fairly priced against peers, while the SWS DCF model suggests a slightly different perspective. With the share price at $84.12 and an estimated future cash flow value of $88.24, the stock appears about 4.7% below that model estimate. Which signal should be treated as more important?
Look into how the SWS DCF model arrives at its fair value.
Simply Wall St performs a discounted cash flow (DCF) on every stock in the world every day (check out CorVel for example). We show the entire calculation in full. You can track the result in your watchlist or portfolio and be alerted when this changes, or use our stock screener to discover 32 high quality undervalued stocks. If you save a screener we even alert you when new companies match - so you never miss a potential opportunity.
Next Steps
Mixed signals around CorVel’s valuation and fundamentals make this a good moment to look under the hood yourself and act while the data is fresh. Weigh the potential benefits and the issues by reviewing the 2 key rewards and 1 important warning sign
Looking for more CorVel sized opportunities?
If CorVel has sharpened your focus on valuation and quality, do not stop here. Broaden your watchlist and give yourself more options before the next move.
- Prioritize quality at a fair price and scan a curated 32 high quality undervalued stocks that filters for strong fundamentals and supportive valuations.
- Seek staying power in tougher markets by checking a 30 resilient stocks with low risk scores that concentrates on resilient balance sheets and calmer volatility profiles.
- Spot tomorrow’s potential early by reviewing a 12 elite penny stocks with strong financials that highlights smaller companies with stronger financial underpinnings than typical micro caps.
Have feedback on this article? Concerned about the content? Get in touch with us directly. Alternatively, email editorial-team@simplywallst.com