


TS TECH (TSE:7313) has put a spotlight on its financial reporting after the Board approved an internal investigative committee and delayed second quarter results for the fiscal year ending March 31, 2027.
Against this backdrop, TS TECH's share price has eased over recent months, with a 30 day share price return down 4.95% and a 90 day share price return down 7.55%. The announcement of delayed results and an internal investigation adds a fresh source of risk to how investors view its reporting quality.
Balance your view on TS TECH by scanning a curated 19 resilient stocks with low risk scores that may offer steadier reporting profiles while this investigation plays out.
TS TECH now trades close to analyst targets despite the recent slide and the reporting probe. Is that a reasonable safety margin, or a signal that caution around the valuation is only just beginning to show up?
Preferred P/E of 24.2x for TS TECH: Is it justified?
TS TECH closed at ¥1,689, and the stock trades on a P/E of 24.2x, which is rich compared to its peers and the sector averages listed by Simply Wall St. Against a backdrop of an internal reporting review and delayed results, that kind of earnings multiple leaves less room for comfort if sentiment weakens further.
The P/E ratio links the share price to earnings per share, so a higher figure means investors are paying more for each unit of profit. For an auto components group like TS TECH, a premium P/E often implies the market is building in durable earnings growth, confident cash generation, or a stronger competitive footing than rivals.
The statements data paint a mixed picture. Earnings are forecast to grow 15.2% per year compared to 9.9% for the wider JP market, yet Return on Equity is currently a low 3% and is projected to remain subdued. Against that quality profile, a P/E of 24.2x looks steep versus the estimated fair P/E of 10.1x, which is a level the market could move towards if expectations cool.
The gap to peers is also wide. TS TECH trades on 24.2x earnings versus a peer average of 11.5x and a JP Auto Components industry average of 9.3x. This signals investors are paying more than double the sector multiple for a business with relatively modest forecast revenue growth of 0.8% per year.
Explore the SWS fair ratio for TS TECH.
Result: Price-to-Earnings of 24.2x (OVERVALUED)
Still, the internal investigation and the tiny discount to the ¥1,682 analyst target leave limited room if TS TECH delivers any unwelcome surprises in its reporting.
Find out about the key risks to this TS TECH narrative.
Another view on TS TECH's valuation
The SWS DCF model comes to a very different conclusion on TS TECH. At a market price of ¥1,689 and an estimated future cash flow value of ¥1,045.05, the stock screens as overvalued on this approach. That gap raises a simple question: Which lens do you trust more when the numbers conflict?
Look into how the SWS DCF model arrives at its fair value.
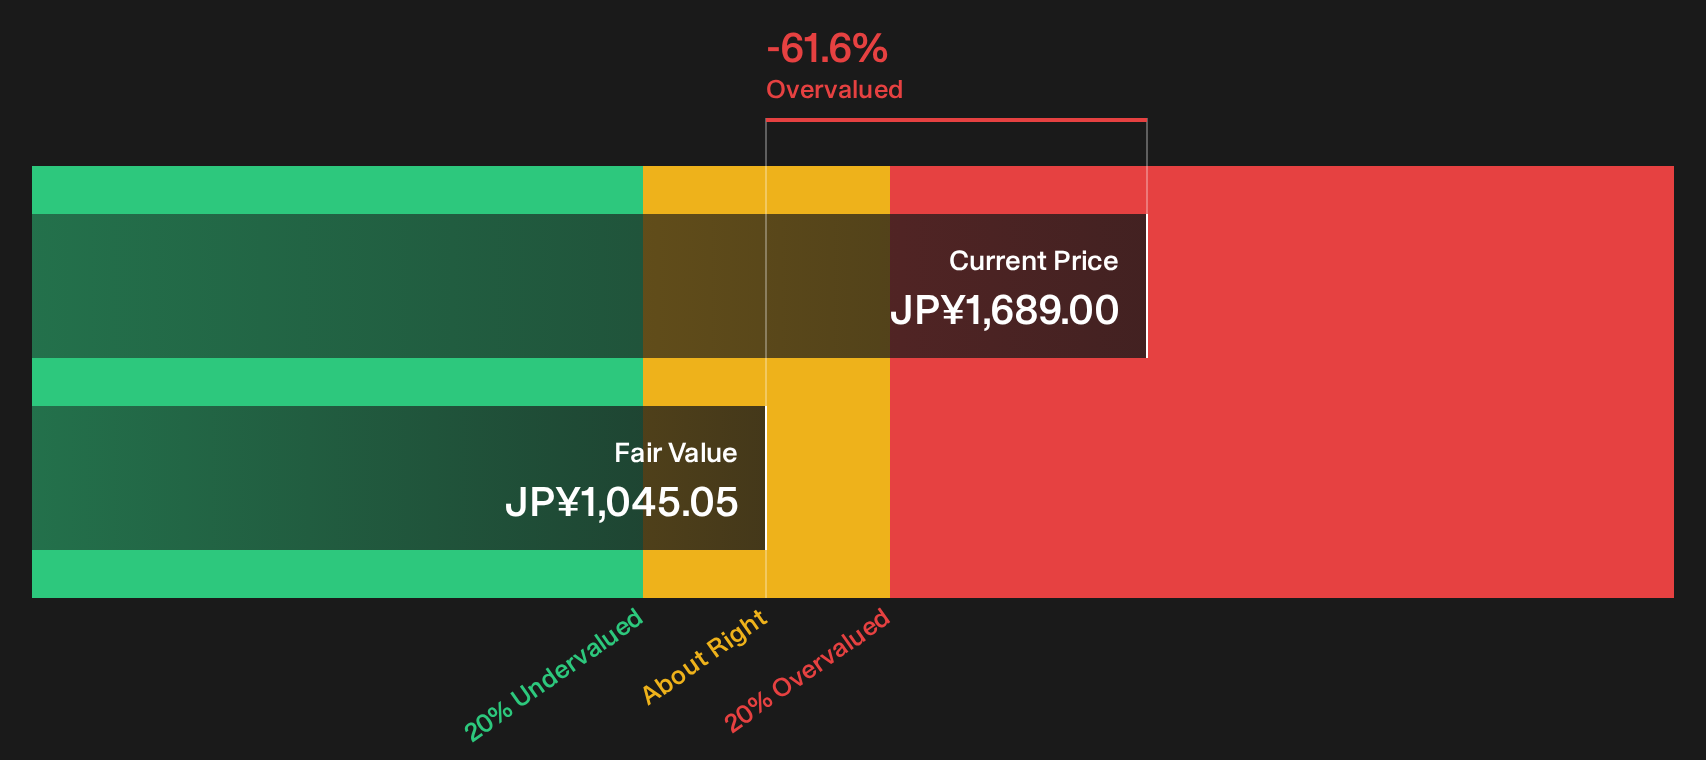
Simply Wall St performs a discounted cash flow (DCF) on every stock in the world every day (check out TS TECH for example). We show the entire calculation in full. You can track the result in your watchlist or portfolio and be alerted when this changes, or use our stock screener to discover 20 high quality undervalued stocks. If you save a screener we even alert you when new companies match - so you never miss a potential opportunity.
Next Steps
Worried the tone around TS TECH feels skewed to the negatives or the positives? Act quickly, review the underlying figures for yourself, and weigh both sides by starting with the 2 key rewards and 1 important warning sign.
Looking for more ideas beyond TS TECH?
Instead of holding cash on the sidelines while this story unfolds, consider evaluating a few alternative opportunities that may be worth your attention.
- Target stability first and filter for companies with strong finances using our list of solid balance sheet and fundamentals (24 results).
- Hunt for value and compare TS TECH against a 20 high quality undervalued stocks that may offer a more comfortable entry point.
- Sharpen your income plan by reviewing a 26 dividend fortresses that could support a steadier stream of payouts.
Have feedback on this article? Concerned about the content? Get in touch with us directly. Alternatively, email editorial-team@simplywallst.com