


Nelnet (NNI) is back in focus after reporting third quarter earnings that showed net income of US$76.19 million and basic earnings per share from continuing operations of US$2.13, both lower than the prior year period.
The latest third quarter update has come with a softer tone and the share price has reflected that, with Nelnet closing at US$126.46 and slipping over the past day and week while still sitting on a strong multi year total shareholder return in the 3 to 5 year range. Investors appear to be weighing the weaker recent earnings against that longer term record, which can gradually cool near term momentum as the market reassesses how much risk it is comfortable taking on at current levels.
Scan beyond Nelnet and compare how other hand picked financial firms with solid cash generation and balance sheets are priced today using our 32 high quality undervalued stocks
Bulls point to Nelnet's multi year shareholder returns and diversified operations, while bears focus on the recent earnings slide and softer share move. Which side does the valuation evidence support next?
Price-to-Earnings of 16.4x: Is it justified?
Nelnet's recent share price of $126.46 comes with a P/E of 16.4x, which points to a richer valuation than both its direct Consumer Finance peers and the wider US market based on current earnings.
The P/E multiple compares Nelnet's share price to its earnings per share. It gives you a quick sense of how much investors are paying today for each dollar of current profit. For a diversified financial services group with loan servicing, education technology, payments and banking operations, earnings quality and stability usually matter a lot when assessing whether that P/E looks stretched or reasonable.
Management has delivered high quality earnings according to the checks, yet profits have declined by 7.9% per year over the past 5 years and net profit margins have moved from 25.4% to 18.9%. When a business shows falling earnings alongside a P/E of 16.4x, the market is effectively paying more for a shrinking profit base. That can suggest investors are baking in a recovery or putting a premium on the diversified model and revenue growth profile instead of current profitability.
The comparison with peers is stark. Nelnet trades at 16.4x earnings compared with a US Consumer Finance industry average of 8.3x and a broader US market multiple of 17.7x. Against its sector, the stock carries a clear premium, which implies the market is assigning much stronger attributes to Nelnet than to the typical consumer finance business in the data set.
See what the numbers say about this price — find out in our valuation breakdown.
Result: Price-to-Earnings of 16.4x (OVERVALUED)
Still, a richer P/E multiple can quickly look exposed if Nelnet’s earnings slide continues, or if the broader US Consumer Finance peer group sees valuations compress.
Find out about the key risks to this Nelnet narrative.
Another View: Our DCF model flags a very different picture
The earlier P/E check described Nelnet as expensive compared with Consumer Finance peers. A second lens using our DCF model is far harsher. On this framework, the stock at $126.46 trades well above an estimated future cash flow value of $24.47, which indicates a materially overvalued profile on cash flows.
This gap suggests buyers today are paying a high price for earnings and an even higher one for the cash the business is expected to generate. For anyone weighing that kind of premium, the key question is simple: Which signal feels more compelling to you, the earnings multiple or the cash flow math?
Look into how the SWS DCF model arrives at its fair value.
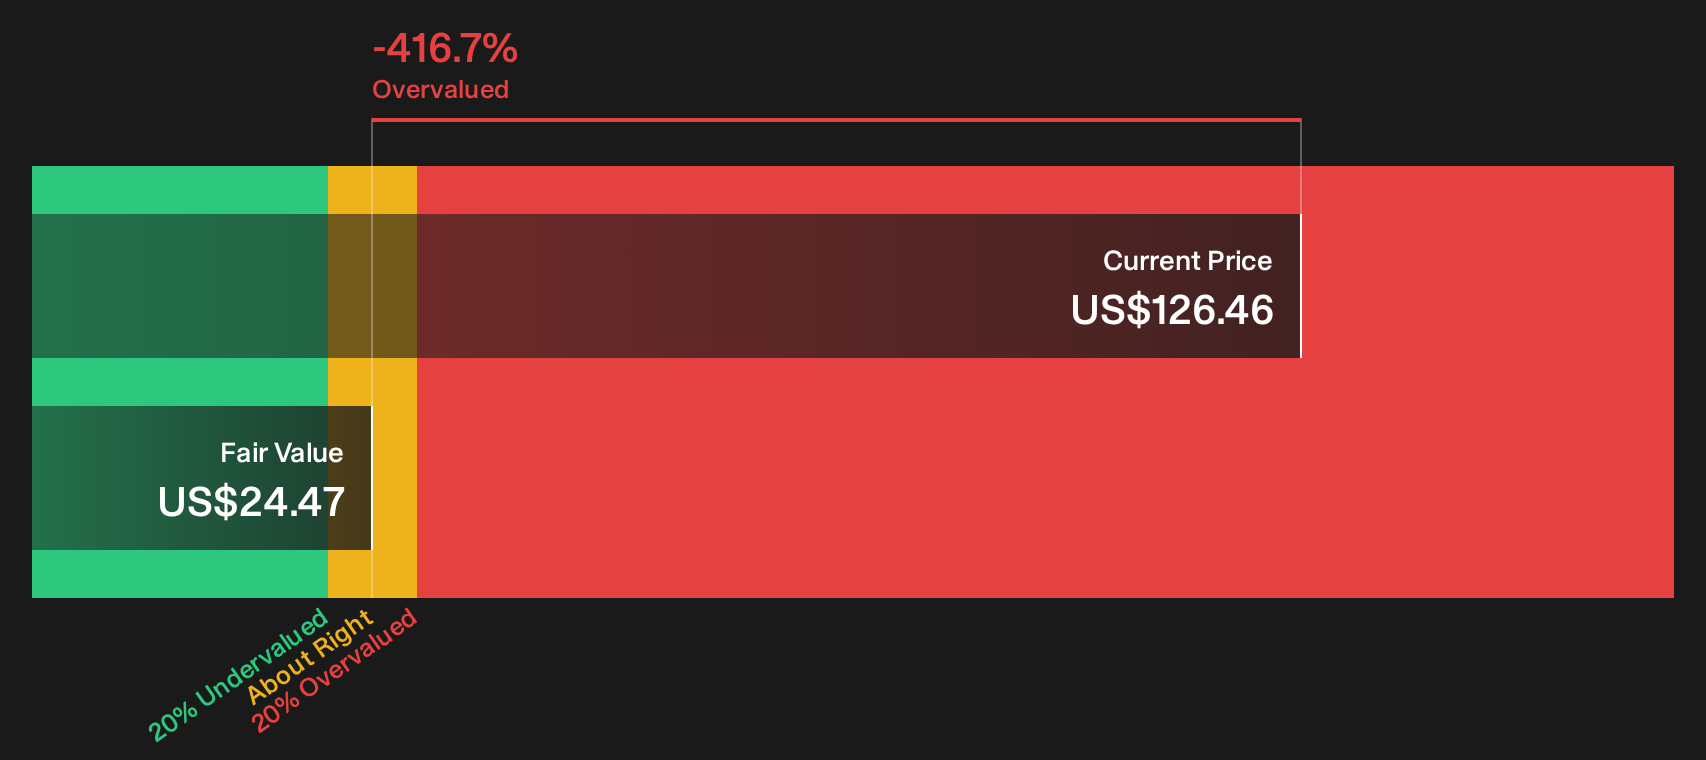
Simply Wall St performs a discounted cash flow (DCF) on every stock in the world every day (check out Nelnet for example). We show the entire calculation in full. You can track the result in your watchlist or portfolio and be alerted when this changes, or use our stock screener to discover 32 high quality undervalued stocks. If you save a screener we even alert you when new companies match - so you never miss a potential opportunity.
Next Steps
Mixed signals on Nelnet can feel confusing, so use that tension as a prompt to move quickly, review the data yourself, and weigh both sides. To see the key trade offs in one place, start with our breakdown of 2 key rewards and 2 important warning signs
Looking for more investment ideas beyond Nelnet?
If Nelnet has you rethinking your watchlist, use that momentum and line up a few fresh candidates that match your risk, income, and quality preferences.
- Consider potential upside in smaller companies by checking out 12 elite penny stocks with strong financials that already show stronger financials than the usual speculative picks.
- Emphasize quality by reviewing a 19 high quality undiscovered gems list that highlights businesses with solid fundamentals that many investors may have overlooked so far.
- Focus on protecting your downside by scanning a 30 resilient stocks with low risk scores group built around resilient balance sheets and lower risk profiles before capital goes into your next idea.
Have feedback on this article? Concerned about the content? Get in touch with us directly. Alternatively, email editorial-team@simplywallst.com