


The Zhitong Finance App learned that according to data from the World Gold Council, the global physical gold ETF inflow was about 2.7 billion US dollars in October, achieving inflows for the fourth month in a row. Europe continues to lead the way. Asian gold ETFs maintain a net inflow trend, and North American funds have a slight net outflow. Total global gold ETF holdings increased by 19 tons to 4,275 tons, setting a record for holdings at the end of the month. The impact of falling gold prices was offset by capital inflows, and total asset management (AUM) fell 6% to US$542 billion.
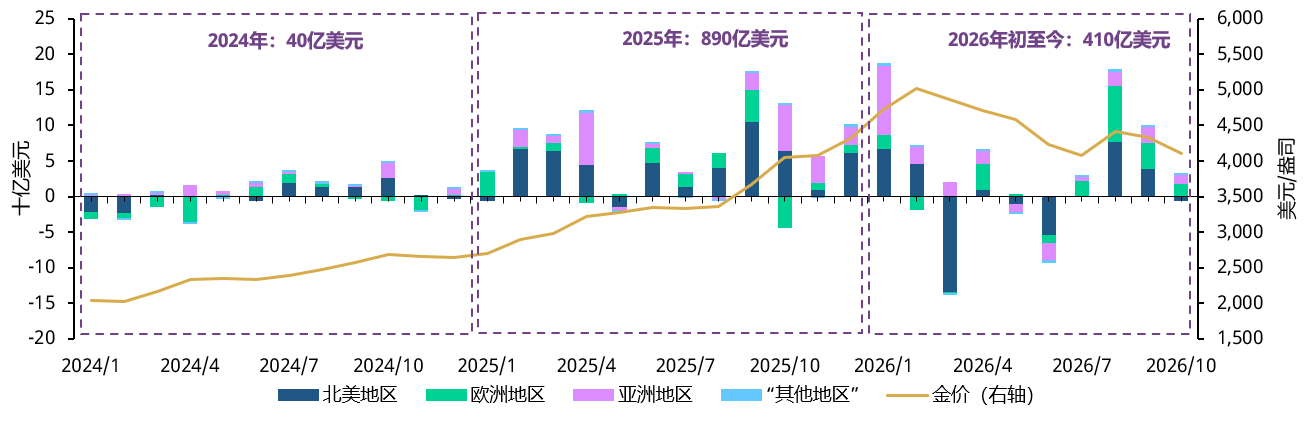
The net inflow of global gold ETFs in the first ten months of this year was about 41 billion US dollars, the third highest level in the same period in history, and total holdings increased by 246 tons. Europe and Asia lead the world (accounting for 44% and 45% of total net inflows, respectively), with UK fund inflows the largest, followed by China.
Regional Overview
North America
In October, there was a small outflow of about $512 million from gold ETFs in North America. It was the only region with outflows in that month. All outflows came from the US. Canadian funds, on the other hand, continue to attract capital inflows.
The reasons for the outflow of North American gold ETFs are: US technology stocks have been sold off; US Treasury bonds have ushered in strong safe-haven purchases.
In October, US technology stocks were sold off as market concerns about capital expenditure related to artificial intelligence intensified. Market pressure caused by this may be one of the reasons for the outflow of gold ETFs in North America. Some investors use their gold holdings as a source of liquidity that can be cashed out at any time. This reflects one of the key attributes of gold: sufficient liquidity helps investors meet their cash needs during periods of market turmoil.
The stock sell-off in the same month also led to strong safe-haven purchases of US Treasury bonds. In October, US Treasury bonds achieved the strongest monthly returns since December 2023, while yields fell from nearly 25-year highs. 4 The price level of US Treasury bonds is attractive, and investors' expectations of aggressive interest rate hikes by the Federal Reserve have eased, which may also increase the attractiveness of US bonds, thereby diverting funds originally invested in gold. However, it is worth noting that in the last week of October, the US stock market fell sharply again, but US gold ETFs recorded small-scale net inflows. This reflects investors' strategic allocation behavior, which may be due to dual motivations: the midterm elections are approaching, the need to diversify portfolios due to political uncertainty, and ongoing fiscal concerns.
European region
European gold ETFs flowed in for four consecutive months, with a net inflow of about US$1.8 billion in October. The UK continues to lead the way, and funds from Germany, Switzerland, and France have also flowed in. The region has achieved net inflows of gold ETFs for 18 consecutive weeks. Despite weakening gold prices, soaring yields on regional bonds, and changes in market expectations about the local central bank's subsequent policy direction, this inflow trend continues.
This indicates that investors may be increasing their strategic allocation of gold ETFs, reflecting the continuing political and financial uncertainty in the region: in France, social unrest, political polarization, and difficulties in fiscal consolidation have suppressed investor sentiment, disrupted the domestic stock market, and boosted the sovereign risk premium.
In the UK, high treasury yields, energy shocks, and shrinking fiscal space have also raised market concerns. Germany's economic momentum is weakening, and the ruling coalition is facing increasing political pressure.
Asia region
In October, gold ETF inflows were about 1.3 billion US dollars, achieving inflows for the fourth month in a row, and China continues to lead the way. Stock market adjustments have deepened, and treasury bond yields have declined further, driving domestic investors to strategically allocate gold ETFs. Despite weakening gold prices, treasury bond yields have declined, further reducing the opportunity cost of holding gold.
Gold ETFs from Japan and India also continued to flow in: the Nikkei index retracted, the inflow of safe-haven funds, and market expectations for the Bank of Japan's future tightening policy moderated, driving the yield on Japanese treasury bonds down; this expectation continued throughout most of the month, and the Bank of Japan kept interest rates unchanged in late October.
Although India's local mutual funds suspended accepting new subscriptions for funds (FoF) in gold funds in mid-October, India's gold ETFs continued to flow in that month.
Other regions
Gold ETFs saw a slight inflow of US$62 million, supported by demand from Australia and South Africa.
In terms of trading volume
In October, the average daily trading volume of the global gold market fell by 8% to US$365 billion, and trading volume in all segments declined. The average daily OTC trading volume fell 2% to US$219 billion.
LBMA trading remained active, with an average daily decline of only 2% month-on-month to US$196 billion, which is significantly higher than the average daily level of US$161 billion in 2025. Exchange trading activity saw the biggest decline, with an average daily decline of 25% to US$140 billion.
COMEX trading volume fell 22%, Shanghai market trading volume fell 31%, and the average daily trading volume of global gold ETFs fell 20% month-on-month to US$6 billion. The decline was mainly due to the North American market, which accounts for the vast majority of global gold ETF trading volume.