


Elkem (OB:ELK) just posted third quarter 2026 figures that paired modestly lower sales with a sharp jump in net income, a combination that can reshape how you think about this stock.
Recent trading suggests investors are warming to the latest report. Elkem’s share price has gained 5.11% over the past week and sits at NOK32.5. The year-to-date share price return of 6.28% contrasts with a 1-year total shareholder return of 27.72%, hinting at momentum rebuilding after earlier weakness.
Compare Elkem’s earnings-driven move with a curated set of materials and industrials plays that also pair shifting sales with profit resilience through 195 high quality undervalued stocks.
Bulls point to Elkem’s sharp earnings rebound and wide modelled discount, while bears flag softer sales and a recent share pullback. Which side does the current valuation lean toward?
Most Popular Narrative: 15% Undervalued
On the Simply Wall St analyst consensus Narrative, Elkem screens as undervalued, with a fair value of NOK38.4 against the latest close at NOK32.5. That view leans on analyst forecasts for revenue, earnings and margins, all discounted at 8.4%.
Elkem's refocus on higher margin silicon, foundry alloys and carbon products, where specialty offerings already make up a large share of earnings, gives scope for a richer mix to support group revenue and EBITDA margins if demand in these niches holds up relative to bulk silicon. Growing policy support in the EU and US for critical raw materials, along with safeguard measures and carbon border mechanisms, is reshaping trade flows in a way that can favor Elkem's Western silicon, ferrosilicon and carbon production and support pricing power and earnings quality.
See why 20 investors see Elkem as 15% undervalued.
Result: Fair Value of NOK38.4 (UNDERVALUED)
Still, this storyline can break if weak demand in automotive and construction keeps volumes muted, or if low silicon pricing from Chinese overcapacity persists longer than analysts expect.
Find out about the key risks to this Elkem narrative.
Another View: What Elkem’s P/E Is Saying
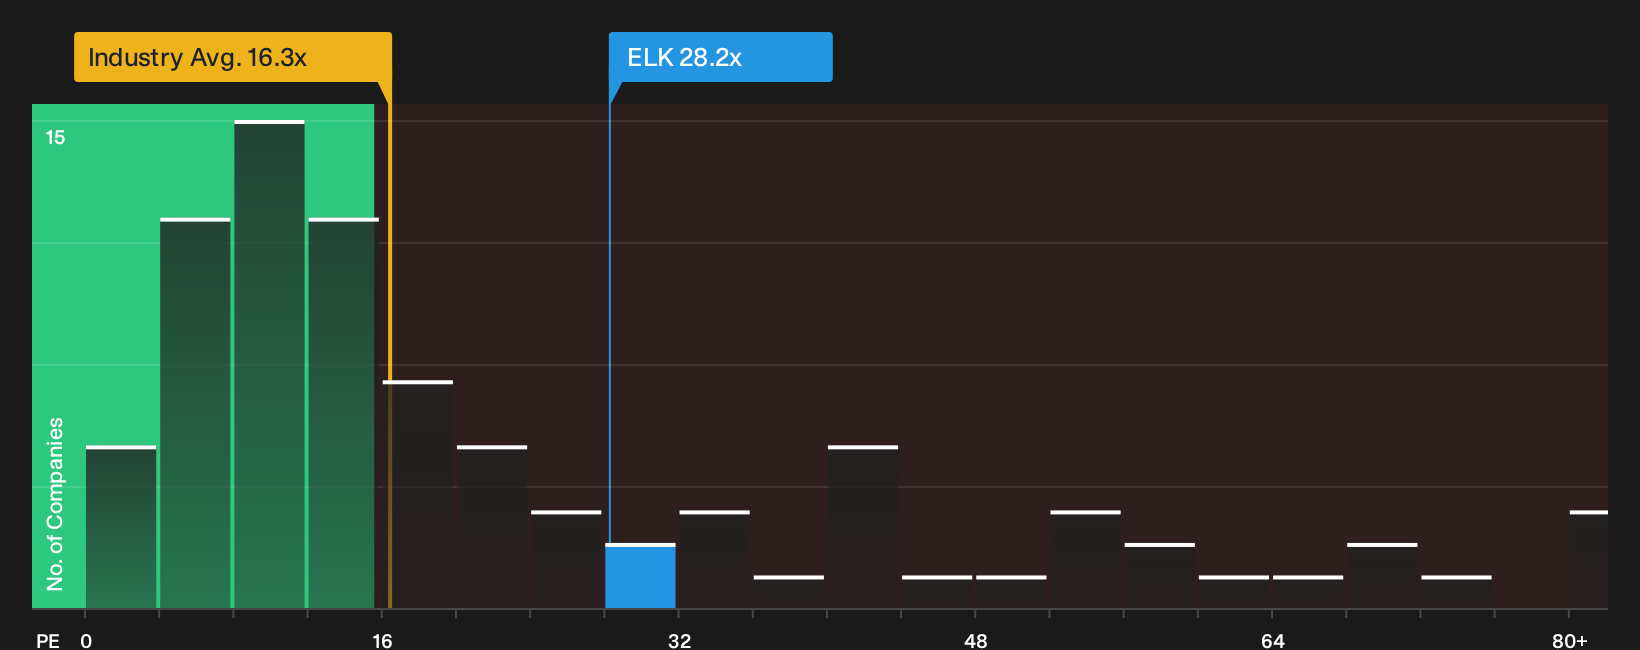
Elkem might look cheap on cash flow models, yet its P/E of 28.2x is higher than the European Chemicals group at 16.4x and only slightly below peers at 28.6x. The fair ratio sits higher again at 48.3x. Is that a margin of safety or extra valuation risk?
To see how this earnings multiple compares with what the numbers indicate the ratio could move toward, take a look at the See what the numbers say about this price — find out in our valuation breakdown..
Next Steps
Mixed signals around Elkem’s valuation and earnings can feel confusing. Consider reviewing the data while it is fresh and pressure test the story yourself with 2 key rewards and 2 important warning signs.
Looking for more investment ideas beyond Elkem?
If you want a fuller watchlist that does not hinge on a single quarter or single stock, broaden your search with a few focused screeners.
- Target resilient income by scanning for companies that offer dependable yields in the 213 dividend fortresses.
- Unearth potential bargains with solid fundamentals by running a focused search through the 195 high quality undervalued stocks.
- Prioritize capital protection and steadier rides by filtering companies via the 206 resilient stocks with low risk scores.
Have feedback on this article? Concerned about the content? Get in touch with us directly. Alternatively, email editorial-team@simplywallst.com