


W. R. Berkley (WRB) has filed an omnibus shelf registration covering debt, common and preferred stock, depository shares, warrants, stock purchase contracts and stock purchase units, giving the insurer broad flexibility for potential future fundraising.
Recent price action has been quietly constructive, with a 30-day share price return of 4.89% and a 90-day gain of 9.42% bringing W. R. Berkley to US$77.15. The 1-year total shareholder return of 3.04% contrasts with a much stronger 3-year total shareholder return of 78.08%, suggesting longer term momentum has been firmer than in the most recent year.
Scan beyond W. R. Berkley and compare it with a curated list of solid balance sheet and fundamentals (23 results) that may offer similar resilience for different parts of your portfolio.
Bulls point to W. R. Berkley’s long run of strong total returns, while bears highlight the recent slowdown and fresh shelf registration. Which side does today’s valuation actually support?
Most Popular Narrative: 11% Overvalued
W. R. Berkley last closed at $77.15, while the analyst consensus Narrative on Simply Wall St anchors fair value at $69.41, implying investors are paying a premium that already bakes in a lot of good news using a 7.24% discount rate.
The expanding complexity of global business and assets is driving demand for specialty insurance solutions. W. R. Berkley is building on this with mid single digit gross and net premium growth in its Insurance segment, alongside current accident year ex cat combined ratios around 89%, which can support revenue and underwriting income.
See why 8 investors see W. R. Berkley as 11% overvalued.
Result: Fair Value of $69.41 (OVERVALUED)
Still, W. R. Berkley’s narrative leans heavily on underwriting discipline and share buybacks. Softer commercial pricing or prolonged reinsurance pullbacks could quickly challenge this approach.
Find out about the key risks to this W. R. Berkley narrative.
Another View: Cash Flows Point To Undervaluation
The analyst consensus on W. R. Berkley leans toward an 11% premium to fair value, yet the SWS DCF model tells a different story. On that cash flow view, WRB at $77.15 trades around 40.2% below an estimated value of $128.93, which raises a simple question: Is the market discounting these cash flows too heavily, or are the cash flow assumptions too generous?
For a closer look at how this cash flow view is built, including the key inputs and sensitivities, Look into how the SWS DCF model arrives at its fair value.
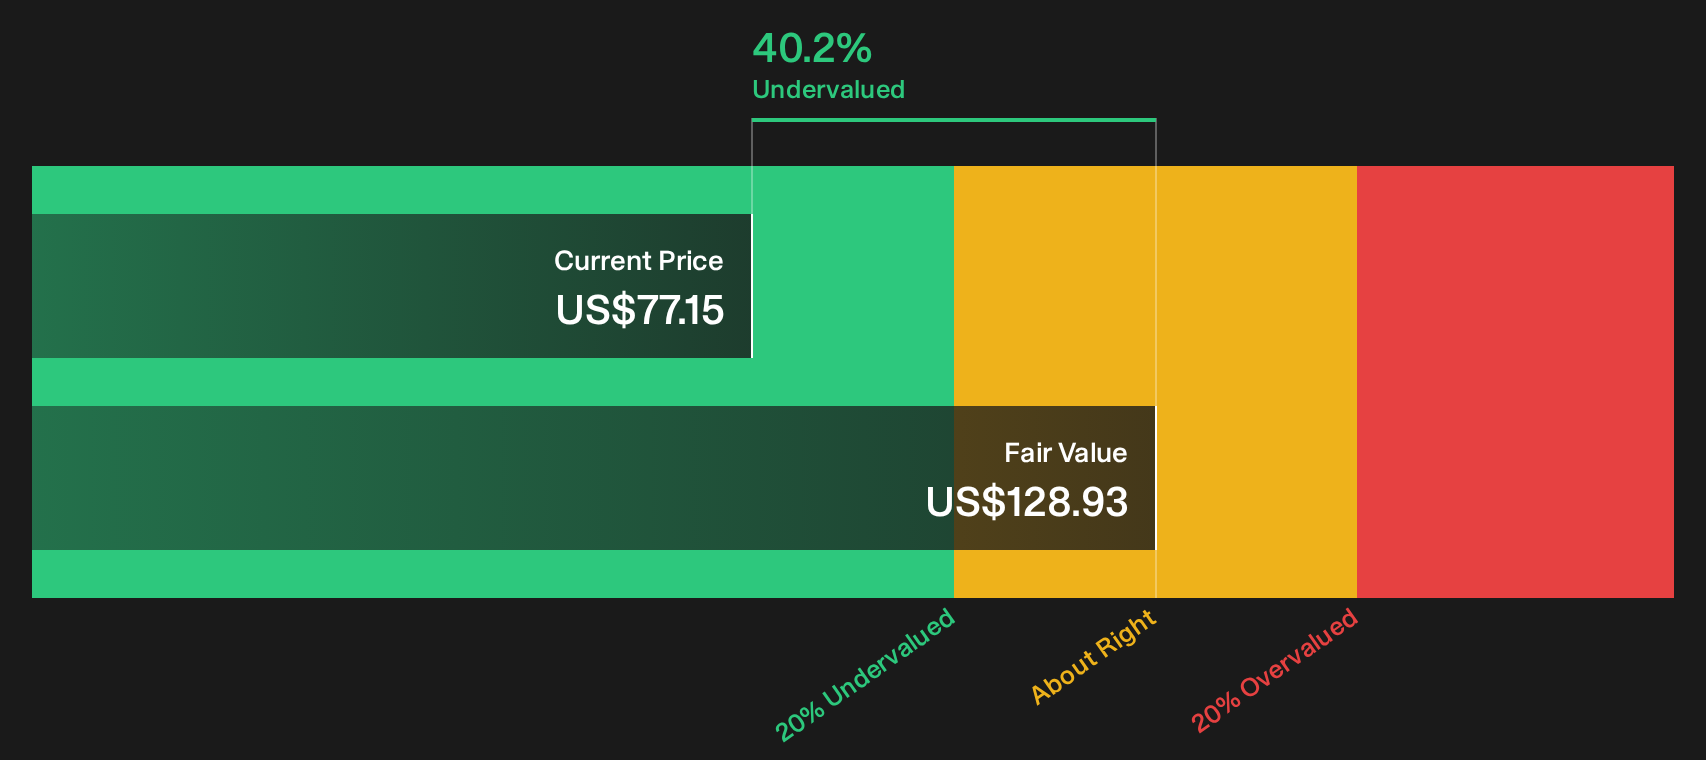
Simply Wall St performs a discounted cash flow (DCF) on every stock in the world every day (check out W. R. Berkley for example). We show the entire calculation in full. You can track the result in your watchlist or portfolio and be alerted when this changes, or use our stock screener to discover 32 high quality undervalued stocks. If you save a screener we even alert you when new companies match - so you never miss a potential opportunity.
Next Steps
Mixed signals on W. R. Berkley today. If you want to move fast and build your own view from the ground up, start by weighing its 1 key reward and 1 important warning sign
Looking for more investment ideas beyond W. R. Berkley?
If W. R. Berkley sharpened your thinking, do not stop here. Fresh opportunities often show up where most investors are not yet looking.
- Target resilient compounding potential by focusing on companies that combine quality with attractive pricing using the 32 high quality undervalued stocks.
- Prioritise capital strength by scanning a list of solid balance sheet and fundamentals (23 results) so you can focus on businesses with room to handle shocks.
- Hunt for underfollowed opportunities through a 20 high quality undiscovered gems that many investors have not put on their radar yet.
Have feedback on this article? Concerned about the content? Get in touch with us directly. Alternatively, email editorial-team@simplywallst.com