


Empire State Realty OP (ESBA) just delivered its third quarter earnings update, giving investors fresh numbers on revenue, profit and per share results that frame the recent property sales activity in Manhattan.
At a share price of US$5.11, Empire State Realty OP has seen its 90 day share price return rise 11.09% and its 30 day move gain 6.46%. However, the year to date share price return is down 18.24% and the 1 year total shareholder return has fallen 24.66%, suggesting recent momentum has picked up after a tougher stretch for longer term holders.
Scan how Empire State Realty OP stacks up against other real estate plays by reviewing the hand picked list of solid balance sheet and fundamentals (23 results).Empire State Realty OP has bounced in the short term while longer term returns remain weak, and earnings recently softened. Does that mix still leave enough upside potential in the current price to justify the risks?
Preferred Price-to-Sales Multiple of 1.9x: Is it justified?
On valuation, Empire State Realty OP screens as inexpensive on revenue. The stock last closed at $5.11, while the business trades on a P/S multiple of 1.9x that sits well below both its peer group and the wider North American REITs pack.
The P/S ratio simply compares the market value of the equity to the annual sales the partnership generates. For real estate vehicles like Empire State Realty OP, it gives you a quick sense of how much investors are willing to pay for each dollar of property and rental income, especially when earnings are currently in loss territory.
Relative to similar real estate operators, that 1.9x P/S is described as good value both against direct peers on 4.5x and the broader North American REITs industry on 2.9x. That is a wide gap that suggests the market assigns a clear discount to ESBA's revenue stream, even though our data also flags that interest payments are not well covered by earnings and the business is still unprofitable. These are important parts of the risk trade off that investors weigh against that lower multiple.
See what the numbers say about this price — find out in our valuation breakdown.
Result: Price-to-Sales of 1.9x (UNDERVALUED)
Still, the recent loss of US$2.693m and interest costs flagged as poorly covered by earnings could pressure Empire State Realty OP if conditions tighten further.
Find out about the key risks to this Empire State Realty OP narrative.
Another View: What The SWS DCF Model Says
The earlier P/S check paints Empire State Realty OP as inexpensive on sales. A different tool, the SWS DCF model, goes further and values the partnership at $14.80 per unit, well above the recent $5.11 price. That points to a wide undervaluation on this framework and raises a simple question: Is the discount compensation for the funding and profitability risks, or an overreaction investors might be pricing too harshly?
Look into how the SWS DCF model arrives at its fair value.
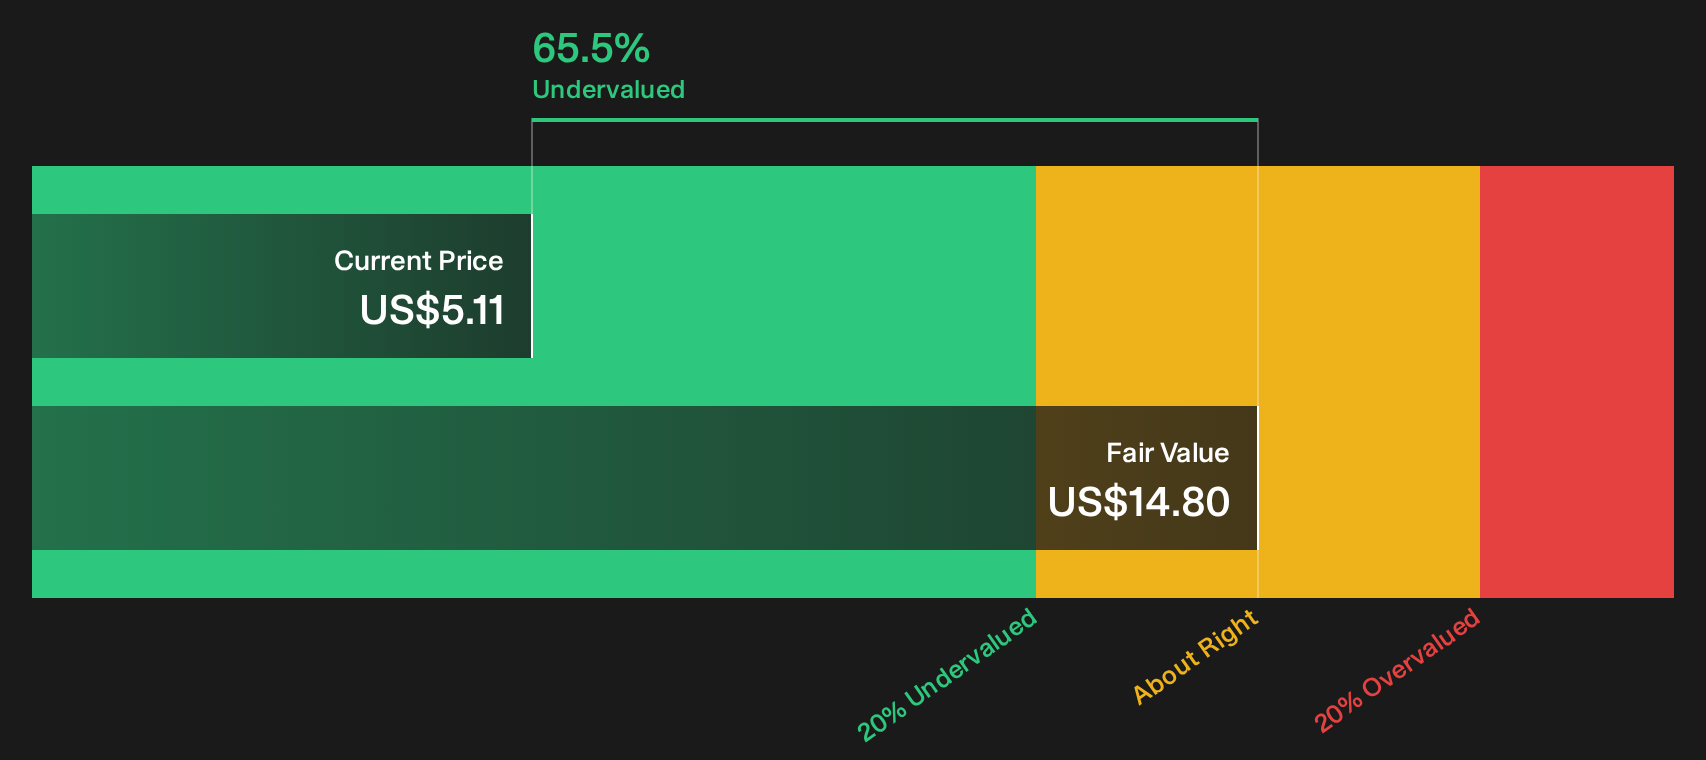
Simply Wall St performs a discounted cash flow (DCF) on every stock in the world every day (check out Empire State Realty OP for example). We show the entire calculation in full. You can track the result in your watchlist or portfolio and be alerted when this changes, or use our stock screener to discover 32 high quality undervalued stocks. If you save a screener we even alert you when new companies match - so you never miss a potential opportunity.
Next Steps
This combination of discounted valuation, funding pressure and mixed sentiment around Empire State Realty OP can look confusing at first glance, so move quickly from headline impressions to the underlying data and form your own view with the 1 key reward and 2 important warning signs
Looking for more investment ideas beyond Empire State Realty OP?
If Empire State Realty OP has sharpened your thinking on value and risk, do not stop here. Cast the net wider so you do not miss other setups that fit your style.
- Target potential mispricings by scanning a curated pool of quality stocks on the 32 high quality undervalued stocks.
- Prioritise resilience by reviewing companies with robust finances and cleaner balance sheets through the list of solid balance sheet and fundamentals (23 results).
- Hunt for underfollowed stories with strong fundamentals that larger funds may have overlooked using the 20 high quality undiscovered gems.
Have feedback on this article? Concerned about the content? Get in touch with us directly. Alternatively, email editorial-team@simplywallst.com