


Mixed quarter sets the stage for fresh questions on U.S. Physical Therapy
U.S. Physical Therapy (USPH) just paired higher third quarter and nine month revenue with lower net income, while reporting losses from continuing operations, putting its recent share price run into sharper focus for investors.
Over the past year, U.S. Physical Therapy has paired a 25.0% year-to-date share price return and a 42.02% 1-year total shareholder return with a recent 15.40% 1-month share price gain, suggesting momentum has been building into November despite the softer earnings line and fresh quarterly dividend announcement at a share price of $98.60.Scan how U.S. Physical Therapy’s mixed quarter compares with other healthcare operators showing resilient fundamentals by running them through our curated list of solid balance sheet and fundamentals (23 results) today.
After a near 42% 1 year total return and a sharp 1 month move, U.S. Physical Therapy now presents a straightforward timing decision. Is this a place to commit fresh capital today, or is it better to wait for a cooler entry?
Most Popular Narrative: 5% Undervalued
On the analyst consensus Narrative on Simply Wall St, U.S. Physical Therapy screens as around 5% below its modeled fair value of $103.83, compared with the last close at $98.60. This frames the recent rally as still within that valuation band.
Operational technology rollouts such as semi virtual front desks, AI assisted documentation and remote therapeutic monitoring, which are already being deployed across the clinic base, are aimed at reducing front desk headcount, improving authorization capture and lifting clinician productivity, which directly targets net margin and earnings improvement.
See why 1 investors see U.S. Physical Therapy as 5% undervalued.
Result: Fair Value of $103.83 (UNDERVALUED)
Still, the U.S. Physical Therapy story can shift quickly if reimbursement tightens or if rising employee medical and labor costs continue to squeeze already pressured margins.
Find out about the key risks to this U.S. Physical Therapy narrative.
Another View on U.S. Physical Therapy’s Valuation
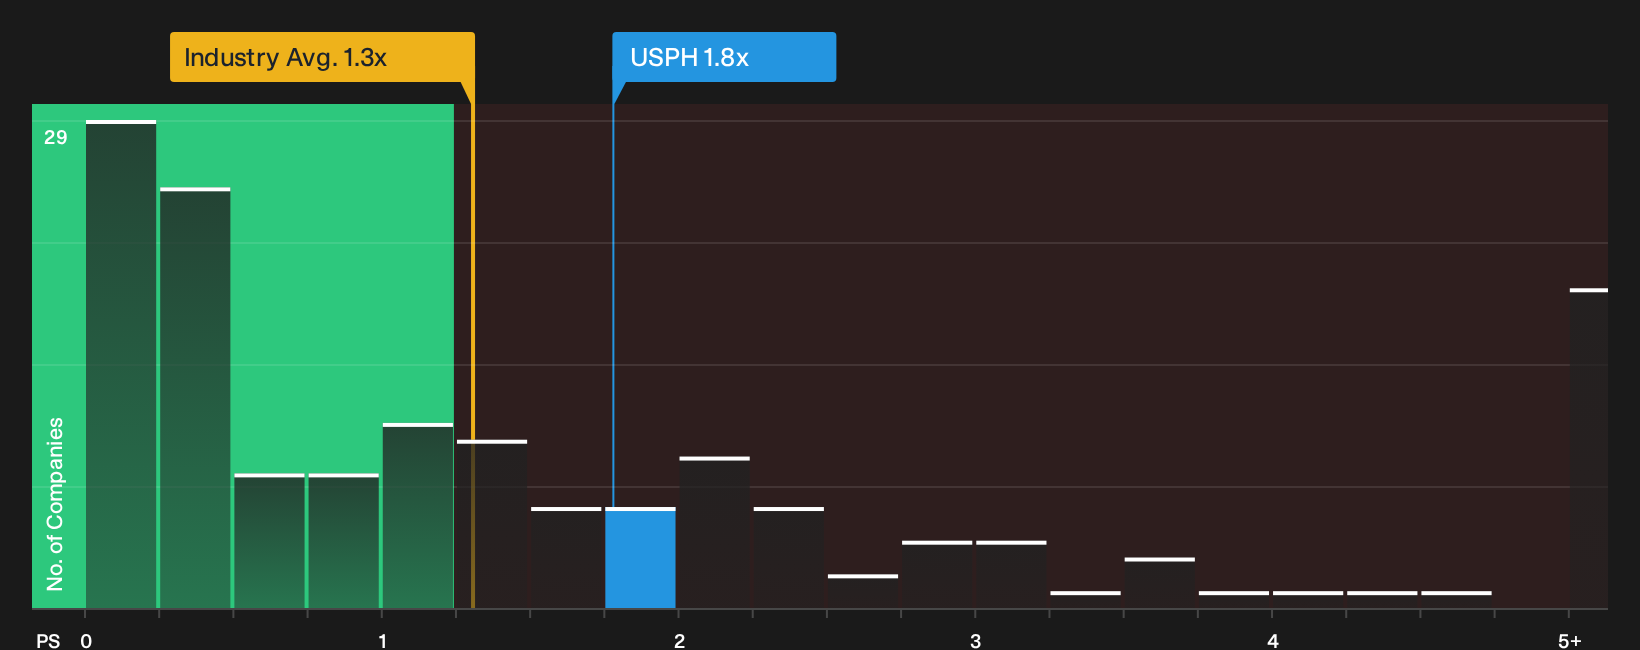
The earlier fair value discussion leans on analyst targets and future earnings assumptions. A simple sales based lens tells a different story. U.S. Physical Therapy trades on a P/S of 1.8x, compared with 1.3x for the wider US Healthcare group and 1.2x for peers, while the fair ratio is 0.9x. That gap points to investors already paying up for the story and raises a practical question: How much optimism are you comfortable baking into every dollar of current revenue?
For a closer look at how this pricing stacks up against fundamentals, have a look at our valuation breakdown, including the fair ratio context, in the See what the numbers say about this price — find out in our valuation breakdown.
Next Steps
Mixed signals rarely stay mixed for long. If U.S. Physical Therapy is on your radar, consider acting promptly and weigh both sides of the story using the 2 key rewards and 1 important warning sign
Looking for more investment ideas beyond U.S. Physical Therapy?
If U.S. Physical Therapy has sharpened your focus, broaden your watchlist by scanning other high conviction setups that might fit your risk, income, and value goals.
- Target financial resilience first and run potential candidates through a 29 resilient stocks with low risk scores so you are not blindsided by avoidable balance sheet trouble.
- Hunt for strong businesses at appealing prices by checking the 32 high quality undervalued stocks and see which opportunities line up with your return expectations.
- Stack potential income and quality together by reviewing the 6 dividend fortresses to spot higher yielding companies that still show solid fundamentals.
Have feedback on this article? Concerned about the content? Get in touch with us directly. Alternatively, email editorial-team@simplywallst.com