


What the latest dividend means for Radian Group investors
Radian Group (RDN) just paired fresh third quarter results with a regular cash payout, affirming a quarterly dividend of $0.255 per share payable on December 8, 2026.
The ex dividend and record dates both fall on November 23, 2026, which means only shareholders on the register that day are eligible for the payment.
Radian Group’s latest quarterly results and dividend decision come after a mixed stretch for the stock, with the share price down 1.4% over the past week but up 8.9% over the last month and a 1-year total shareholder return of 7.4%. The 5-year total shareholder return of about 2x hints at momentum that has built over a longer period, even as short-term moves reflect shifting views on growth prospects and risk.
Scan hand picked income ideas that echo Radian Group's mix of earnings strength and regular payouts with our 6 dividend fortresses.After a strong quarter, a steady dividend and a share price that has already moved higher over the past month, does Radian Group still offer enough upside to justify the risk at today’s valuation?
Price-to-Earnings of 8x: Is it justified?
On valuation, Radian Group trades on a P/E of 8x, which is low compared with peers and the wider US Diversified Financial industry based on the available data.
The P/E ratio links the current share price to the earnings that Radian Group is generating today. For a mortgage insurance specialist, this metric is often a quick way for investors to weigh what the market is willing to pay for each dollar of profit, especially when earnings quality is described as high and the business already has an established track record.
Radian Group is flagged as trading at good value compared with peers and its sector. The P/E level looks compressed next to both the peer average of 9.7x and the industry average of 14.8x. Compared with an estimated fair P/E of 11.7x, the current multiple suggests the market is pricing in a more cautious earnings outlook than the fair ratio indicates the shares could eventually reflect.
Explore the SWS fair ratio for Radian Group.
Result: Price-to-Earnings of 8x (UNDERVALUED)
Still, Radian Group depends on US housing credit conditions and mortgage origination trends. As a result, any downturn or tighter lending cycle could quickly cool the current valuation story.
Find out about the key risks to this Radian Group narrative.
Another view on Radian Group’s value
The P/E story already points to Radian Group looking inexpensive. A second lens, the SWS DCF model, goes much further, putting fair value at $111.07 per share versus a market price of $36.75. That gap signals a big implied upside, but how much faith should you place in a long range cash flow model for a mortgage insurer?
Look into how the SWS DCF model arrives at its fair value.
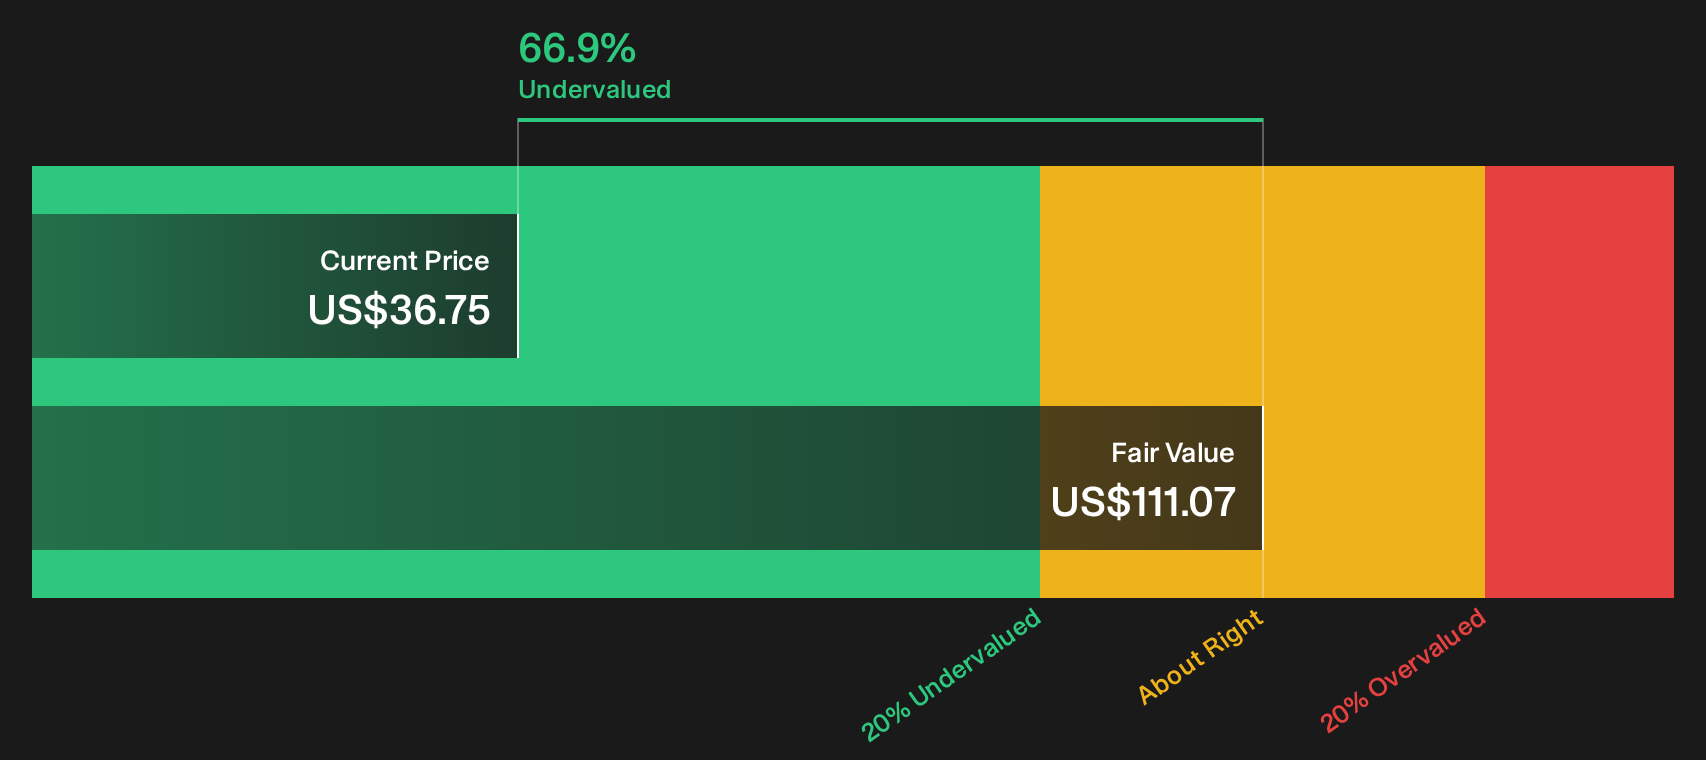
Simply Wall St performs a discounted cash flow (DCF) on every stock in the world every day (check out Radian Group for example). We show the entire calculation in full. You can track the result in your watchlist or portfolio and be alerted when this changes, or use our stock screener to discover 32 high quality undervalued stocks. If you save a screener we even alert you when new companies match - so you never miss a potential opportunity.
Next Steps
Mixed messages on Radian Group’s value and risk profile can feel confusing, so it makes sense to move quickly, test the data yourself and decide where you stand. For a concise breakdown of what the market sees on both sides of the debate, start with the 4 key rewards and 1 important warning sign.
Looking for more investment ideas beyond Radian Group?
If you like Radian Group’s mix of earnings strength and income, do not stop here. Broader opportunities often start with a single smart comparison.
- Spot potential mispricing early by scanning our broader universe of companies that screen as attractively valued using the 32 high quality undervalued stocks.
- Prioritise resilience by sorting for businesses that combine sturdy finances with solid fundamentals through the list of solid balance sheet and fundamentals (23 results).
- Hunt for lesser known opportunities by checking out financially strong outsiders highlighted in the 20 high quality undiscovered gems.
Have feedback on this article? Concerned about the content? Get in touch with us directly. Alternatively, email editorial-team@simplywallst.com