


Taiheiyo Cement (TSE:5233) just posted half-year results to September 30, 2026, with sales of ¥469,278 million and net income of ¥36,748 million, putting fresh attention on the stock.
The latest half year report has come against a mixed backdrop for Taiheiyo Cement, with the share price slipping 3.4% over the past three months and 2.7% over the past month, yet still delivering a 3.3% year to date share price gain and a 11.5% total shareholder return over the past year. This points to longer term momentum holding up better than recent trading suggests as investors reassess growth potential and risk after the strong earnings release.
Scan beyond Taiheiyo Cement and size up other materials players riding similar earnings momentum with our hand picked 19 high quality undervalued stocks in the sector.
Taiheiyo Cement now pairs stronger recent earnings with a share price that has cooled in the short term. Does that mix still tilt the risk reward in favour of buyers, or has most of the easy value already been taken?
Preferred P/E of 11.8x for Taiheiyo Cement: Is it justified?
Taiheiyo Cement is trading on a P/E of 11.8x, which prices the stock at ¥4,083 and leaves it looking more expensive than both its sector peers and the wider basic materials industry on this single measure.
The P/E ratio compares the current share price to earnings per share. For a mature materials group like Taiheiyo Cement, this multiple is often used as a shorthand for how much investors are willing to pay today for each unit of profit, especially when earnings forecasts and cash generation matter more than rapid expansion.
On peer comparison, the shares change hands at a higher P/E than the direct peer average of 11.1x and the JP Basic Materials industry average of 9.5x. This suggests the market is paying a clear premium for this business. At the same time, that 11.8x level sits below an estimated fair P/E of 16.1x. If the market moved closer to this fair ratio, the current premium to sector averages could still be absorbed without looking stretched.
Explore the SWS fair ratio for Taiheiyo Cement.
Result: Price-to-earnings of 11.8x (ABOUT RIGHT)
Still, the Taiheiyo Cement story can be knocked off course if earnings momentum fades or if global construction demand weakens from this point.
Find out about the key risks to this Taiheiyo Cement narrative.
Another lens on Taiheiyo Cement’s value
The P/E premium paints Taiheiyo Cement as slightly expensive, yet the SWS DCF model points the other way. With the share price at ¥4,083 versus an estimated future cash flow value of ¥4,473.07, the stock trades about 8.7% below that cash flow based view.
That gap hints at a market that is paying up on earnings multiples while still pricing in a margin of safety on long term cash generation. The question for you is which signal carries more weight when profits, cash flow and construction demand all pull in different directions.
Look into how the SWS DCF model arrives at its fair value.
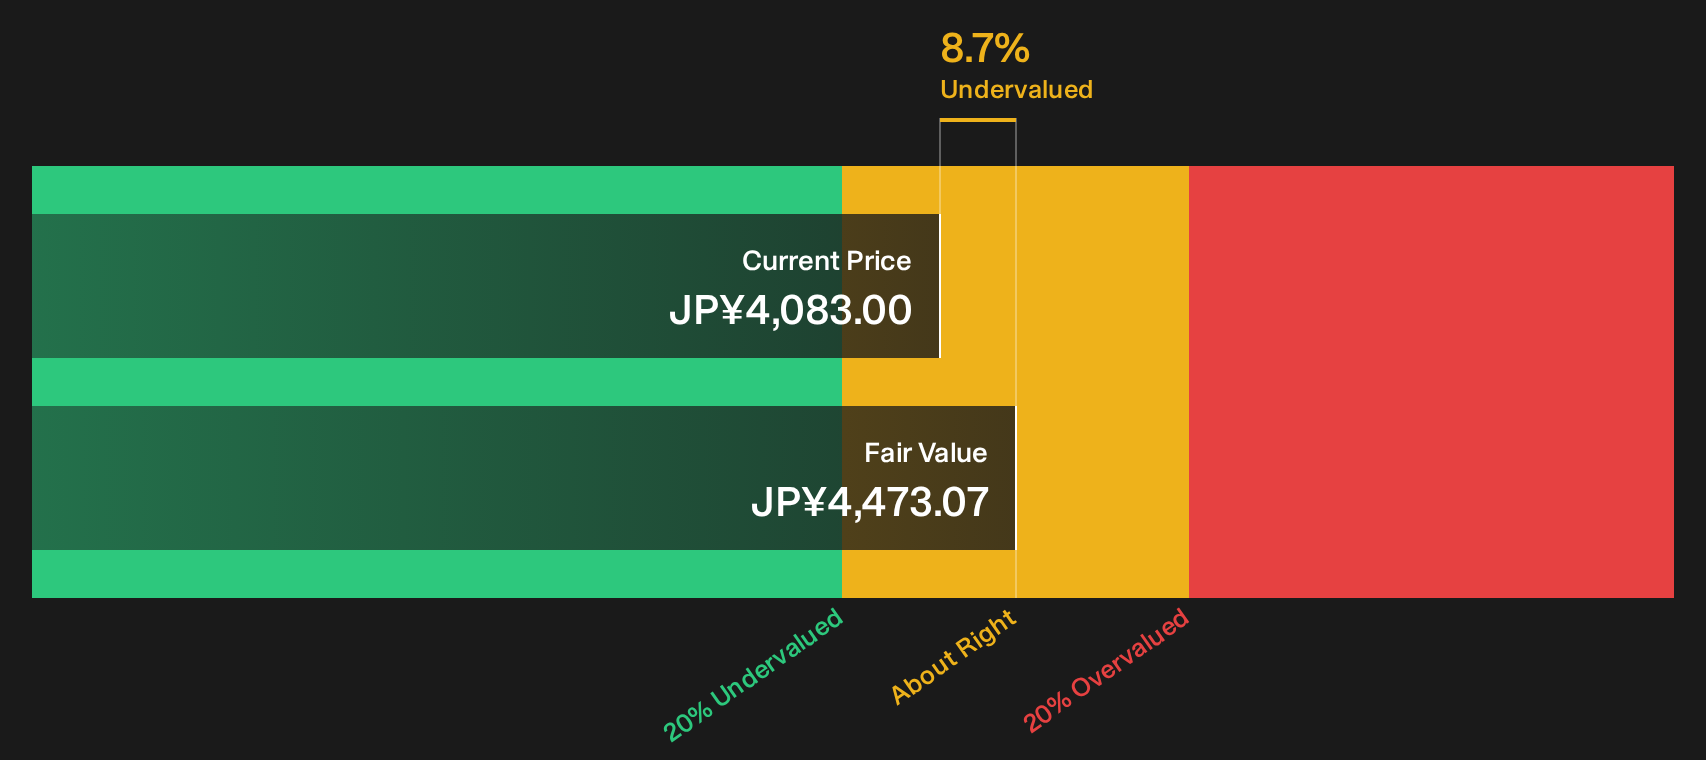
Simply Wall St performs a discounted cash flow (DCF) on every stock in the world every day (check out Taiheiyo Cement for example). We show the entire calculation in full. You can track the result in your watchlist or portfolio and be alerted when this changes, or use our stock screener to discover 19 high quality undervalued stocks. If you save a screener we even alert you when new companies match - so you never miss a potential opportunity.
Next Steps
Mixed signals around Taiheiyo Cement can feel confusing, so move quickly, test the numbers yourself and weigh both sides of the story with the 2 key rewards and 3 important warning signs
Looking for more investment ideas beyond Taiheiyo Cement?
If Taiheiyo Cement has sharpened your focus on value and quality, do not stop here. The next decision you make could influence your returns.
- Target resilient balance sheets and steadier fundamentals by scanning companies in our list of solid balance sheet and fundamentals (24 results).
- Look for potential mispriced opportunities where quality and value align using the 19 high quality undervalued stocks.
- Build a cash flow focused portfolio with income candidates highlighted in the 28 dividend fortresses.
Have feedback on this article? Concerned about the content? Get in touch with us directly. Alternatively, email editorial-team@simplywallst.com