


Popular (BPOP) just declared a fresh round of income payments on its preferred and trust preferred securities, a small but concrete event that income focused investors tend to watch closely.
Those preferred payouts land at a time when Popular’s common shares have cooled from recent highs, with the share price down about 11% over the past three months but still showing a 25.3% year to date share price return and a 40.7% total shareholder return over the past year, which suggests that long term momentum has been stronger than the latest pullback.
Scan beyond Popular’s latest preferred payouts and recent share pullback to see how it compares with a curated 32 high quality undervalued stocks that also pair income potential with balance sheet strength.
After an 11% pullback and with Popular changing hands below both analyst targets and intrinsic value estimates, the gap between price and fair value looks wide enough to measure. How far off are those curves?
Price-to-Earnings of 9.9x: Is it justified?
Popular’s valuation picture starts with a simple anchor. At a last close of $157.88, the stock trades on a P/E of 9.9x that screens as good value against both peers and broader US banks.
The P/E ratio compares what investors are paying today for each dollar of Popular’s earnings. For a lender with a long operating history, earnings quality matters as much as the headline multiple, and here the business scores firmly in the “high quality earnings” bucket, with current net profit margins of 32.2% versus 27% a year earlier.
That gap between price and earnings power is reinforced in two ways. First, the P/E of 9.9x sits below the US Banks industry average of 11.3x and below a peer group average of 12.7x. This suggests the market is assigning a discount relative to comparable institutions. Second, the estimated fair P/E for Popular is 11.8x. This is a level the market could move toward if sentiment around its earnings profile and 2.28% dividend support were to align more closely with sector norms.
Explore the SWS fair ratio for Popular.
Result: Price-to-Earnings of 9.9x (UNDERVALUED)
Still, that discount can close quickly if Popular faces a sharper pullback in Puerto Rico or US credit demand, or if funding costs squeeze those 32.2% margins.
Find out about the key risks to this Popular narrative.
Another View: Popular Through A Cash Flow Lens
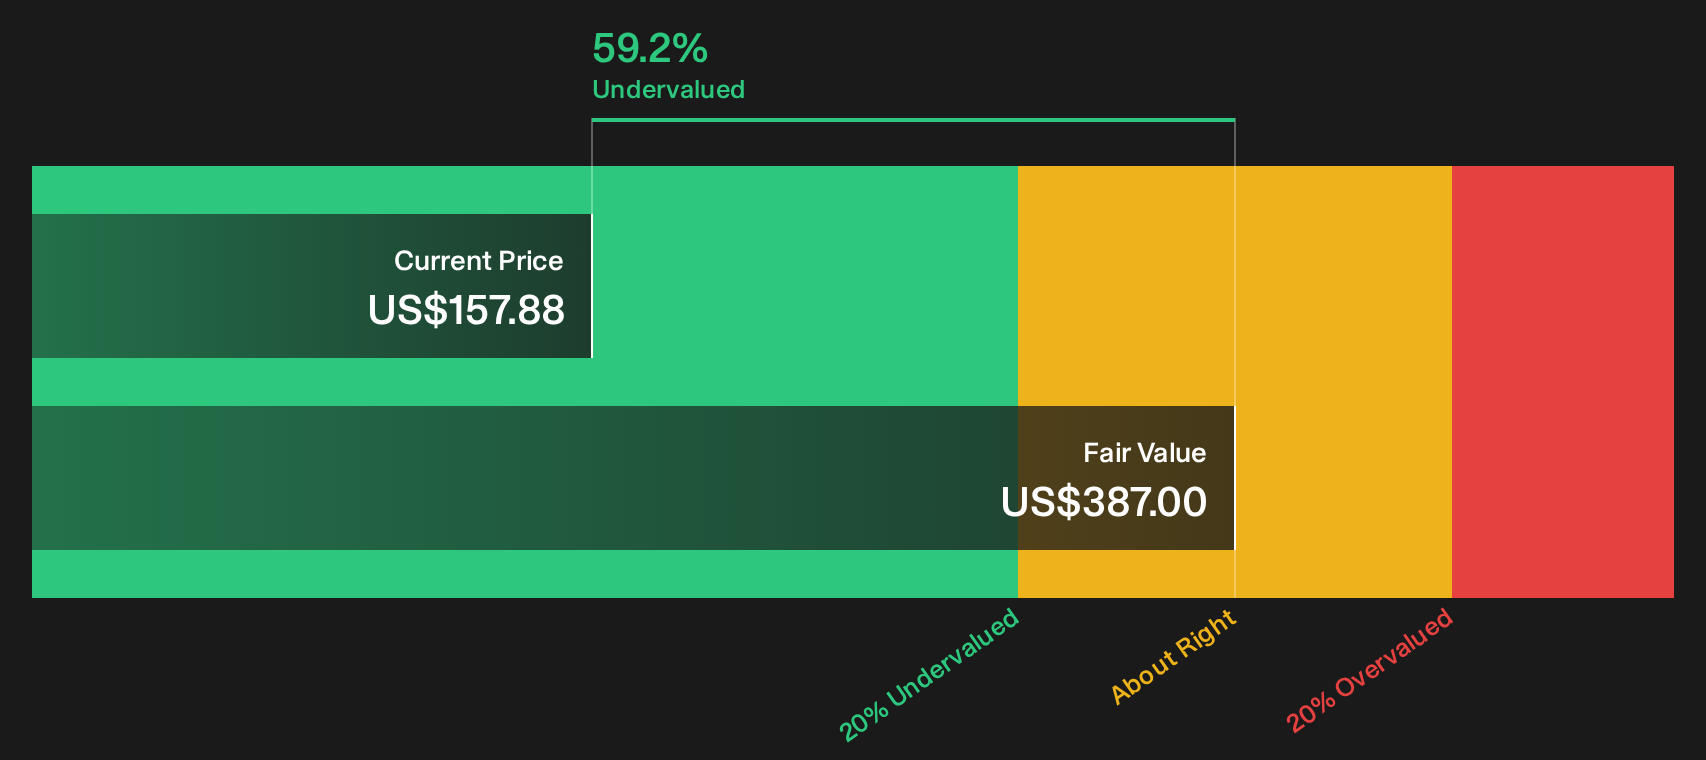
A different lens on Popular uses our DCF model rather than the earnings multiple. On that framework, the estimated future cash flow value sits at $387 per share versus a market price of $157.88, which points to a wide undervaluation gap that readers need to sanity check.
The model suggests a discount of about 59.2% to that future cash flow value. For an investor, that kind of spread can either flag a potential opportunity if the assumptions hold up, or a sign that the market is pricing in risks that simple earnings ratios do not capture. Which side of that trade do you think is closer to reality?
Look into how the SWS DCF model arrives at its fair value.
Simply Wall St performs a discounted cash flow (DCF) on every stock in the world every day (check out Popular for example). We show the entire calculation in full. You can track the result in your watchlist or portfolio and be alerted when this changes, or use our stock screener to discover 32 high quality undervalued stocks. If you save a screener we even alert you when new companies match - so you never miss a potential opportunity.
Next Steps
Seen enough to get a feel for how sentiment around Popular stacks up against the numbers, but still wrestling with your own view? Move quickly from reading to testing the figures yourself, then pressure test that optimism by checking the 5 key rewards.
Looking for more Popular investment ideas?
Ready to widen your watchlist beyond Popular and put a few more high conviction ideas on your radar before the next big move breaks?
- Target dependable income by scanning for higher yield opportunities backed by robust payouts through a focused 6 dividend fortresses.
- Zero in on mispriced opportunities where quality and valuation meet by running a fresh screen using the 20 high quality undiscovered gems.
- Prioritise resilience by filtering for companies with sturdy finances and consistent fundamentals through the list of solid balance sheet and fundamentals (24 results).
Have feedback on this article? Concerned about the content? Get in touch with us directly. Alternatively, email editorial-team@simplywallst.com