


The Dow Jones Industrial Average ($DOWI) was down over 1,000 points at its session low ahead of highly anticipated quarterly earnings from one of its 30 components, Nvidia (NVDA).
The State Street SPDR Dow Jones Industrial Average ETF Trust (DIA), which proxies the price-weighted benchmark, fell back to test its closely watched 200-day moving average in today’s session before paring losses.
Looking back to March and April, DIA broke support at its 200-day moving average earlier this year, with the 14-day Relative Strength Index (RSI) falling as far south as 25 before the blue-chip ETF eventually found bottom.
In the chart below, sharp-eyed technicians will note what appears to be a bearish head-and-shoulders pattern in the RSI preceding this week’s Dow dump. The RSI can predict price action by mimicking familiar chart patterns, although in this example, it would be a somewhat lower-conviction signal – our Senior Market Strategist John Rowland, CMT, would prefer to see the “head” peeking up into oversold territory. To learn more about reading RSI beyond overbought & oversold signals, register for John Rowland’s Wednesday afternoon webinar.
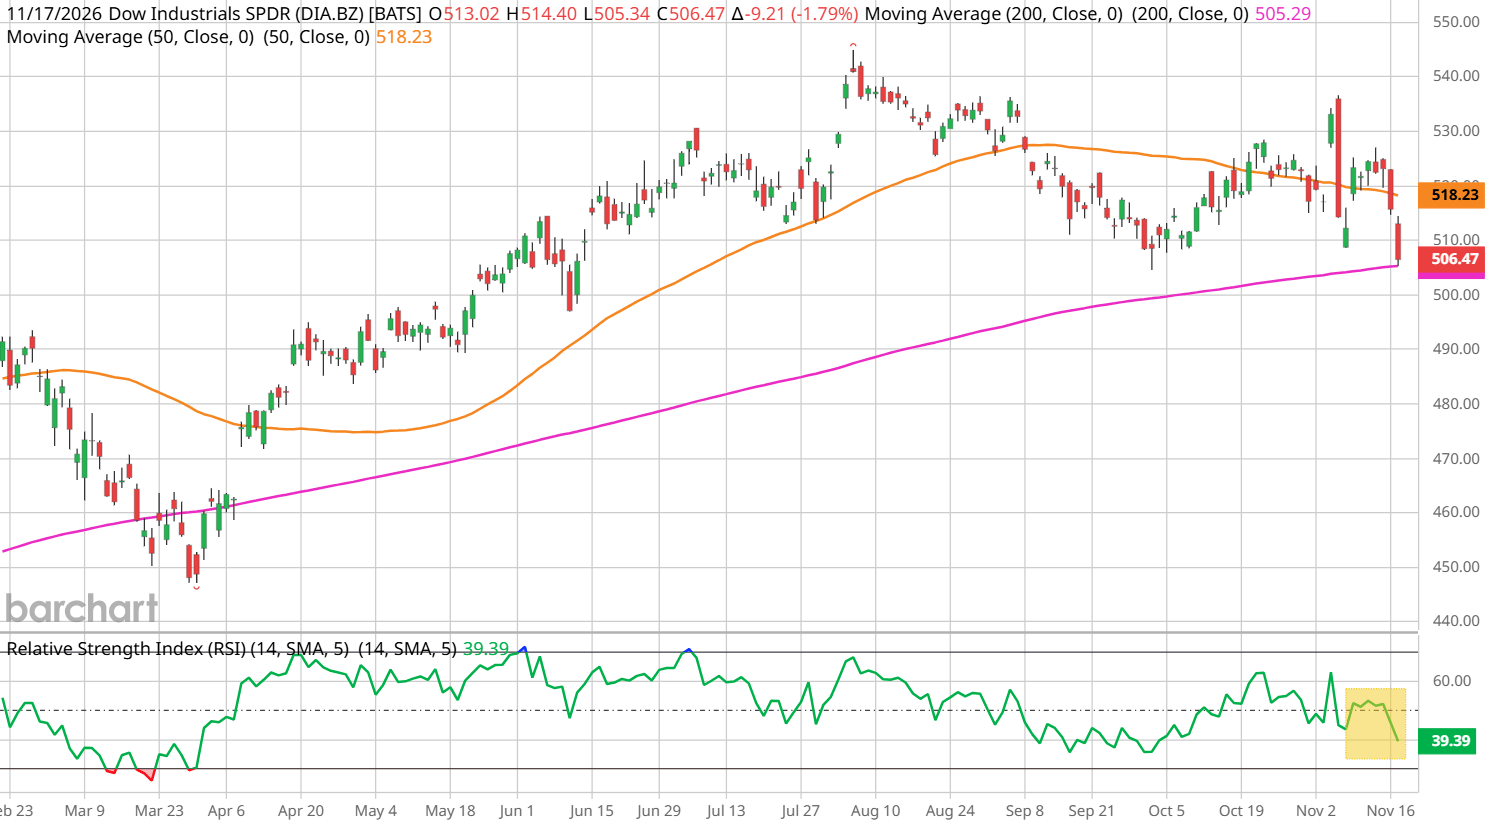
Beyond the 200-day, here are 5 more key technical levels to watch that could play the role of short-term support for DIA:
- 500.75 – 50-week moving average
- 500.00 – Gamma exposure “put wall”
- 498.60 – 50% retracement of its 52-week high & low
- 498.60 – Implied November series options move (downside)
- 486.89 – 10% drawdown from YTD closing high
On the date of publication, Elizabeth H. Volk had a position in: NVDA . All information and data in this article is solely for informational purposes. For more information please view the Barchart Disclosure Policy here.