

Introducing DIY Portfolio
At Webull, we understand that every investor has unique financial goals and risk tolerance. The DIY Portfolio feature was developed to provide Webull users with the flexibility and control to build and manage their own investment strategies.
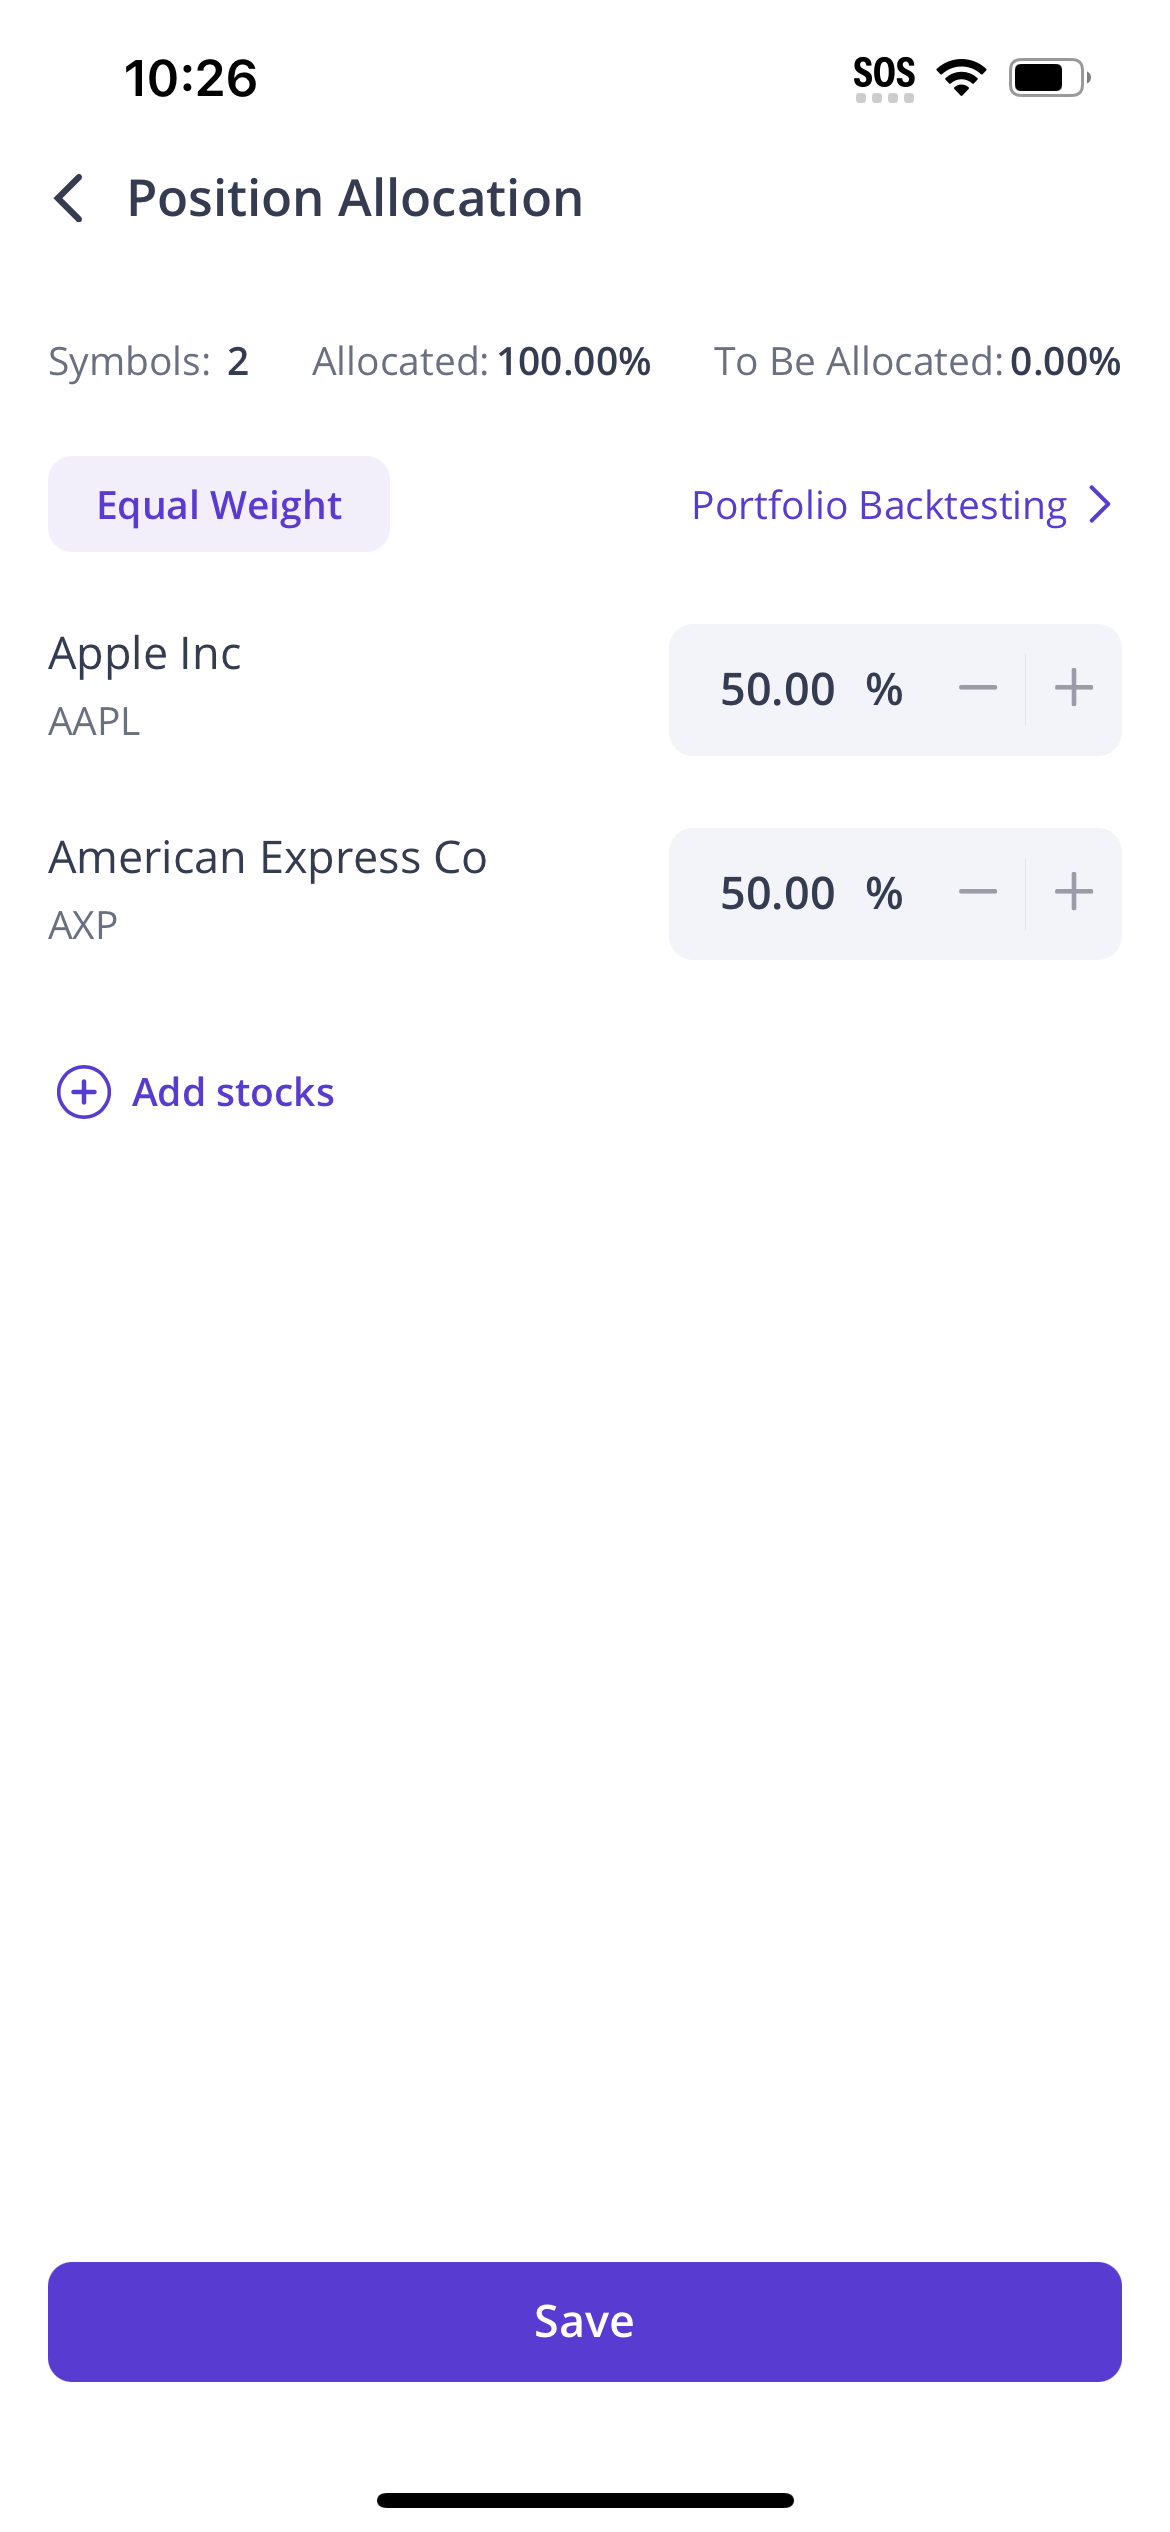
DIY Portfolio allows Webull users to build their own portfolio by selecting securities and distributing the weighting for each security in the portfolio. With this feature, Webull users can easily select multiple US stocks and ETFs that align with their investment goals and by back-testing using various indicators can finetune their portfolio.
Benefits of DIY Portfolio
1. Customisation: DIY Portfolio offers unparalleled customisation, enabling you to choose from a wide range of US stocks and ETFs. You can distribute the weighting of each security according to your investment strategy, giving you complete control over your portfolio composition.
2. Fractional shares: With the ability to invest in fractional shares, you can diversify your portfolio even with a modest investment amount. This feature ensures that you can include high-value stocks without needing to purchase whole shares.
3. Recurring Investments: Set up recurring investment plans to automate your contributions to your DIY Portfolio. This helps you stay consistent with your investment strategy and take advantage of dollar-cost averaging.
4. Back Testing Tools: DIY Portfolio includes robust back- testing tools that allow you to evaluate the historical performance of your investment strategy. This feature provides valuable insights into the potential strengths and weaknesses of your portfolio before you commit real money.
Understanding Back Testing Tools and Indicators
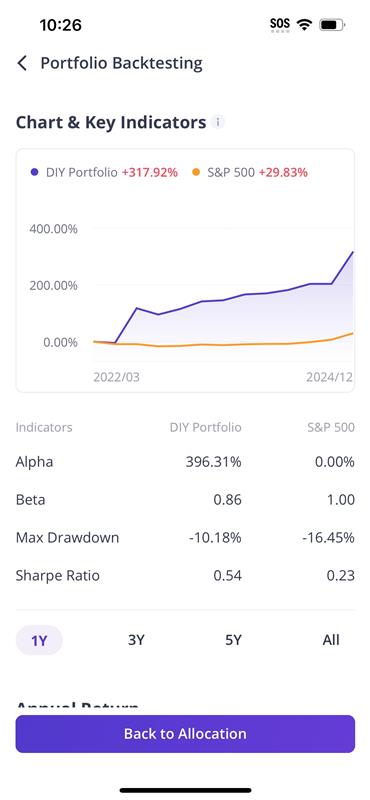
Back testing is a powerful tool that simulates how your investment strategy would have performed in the past. By applying historical market data, you can gain insights into the potential future performance of your portfolio. Here are the key indicators used in back testing:
Alpha
Alpha measures the performance of your portfolio compared to a benchmark index, such as the S&P 500. A positive alpha indicates that your portfolio has outperformed the benchmark, while a negative alpha suggests underperformance.
Beta
Beta indicates the volatility or risk of your portfolio relative to the market. A beta of 1 means your portfolio moves in line with the market. A beta greater than 1 indicates higher volatility, while a beta less than 1 suggests lower volatility.
Max Drawdown
Max drawdown represents the largest drop from peak to trough in the value of your portfolio over a specific period. This metric helps assess the potential risk and worst-case scenario for your investment strategy.
Sharpe Ratio
The Sharpe ratio measures the risk-adjusted return of your portfolio. It is calculated by subtracting the risk-free rate from your portfolio's return and dividing by the standard deviation (volatility). A higher Sharpe ratio indicates better risk-adjusted performance.
Sage Tracker
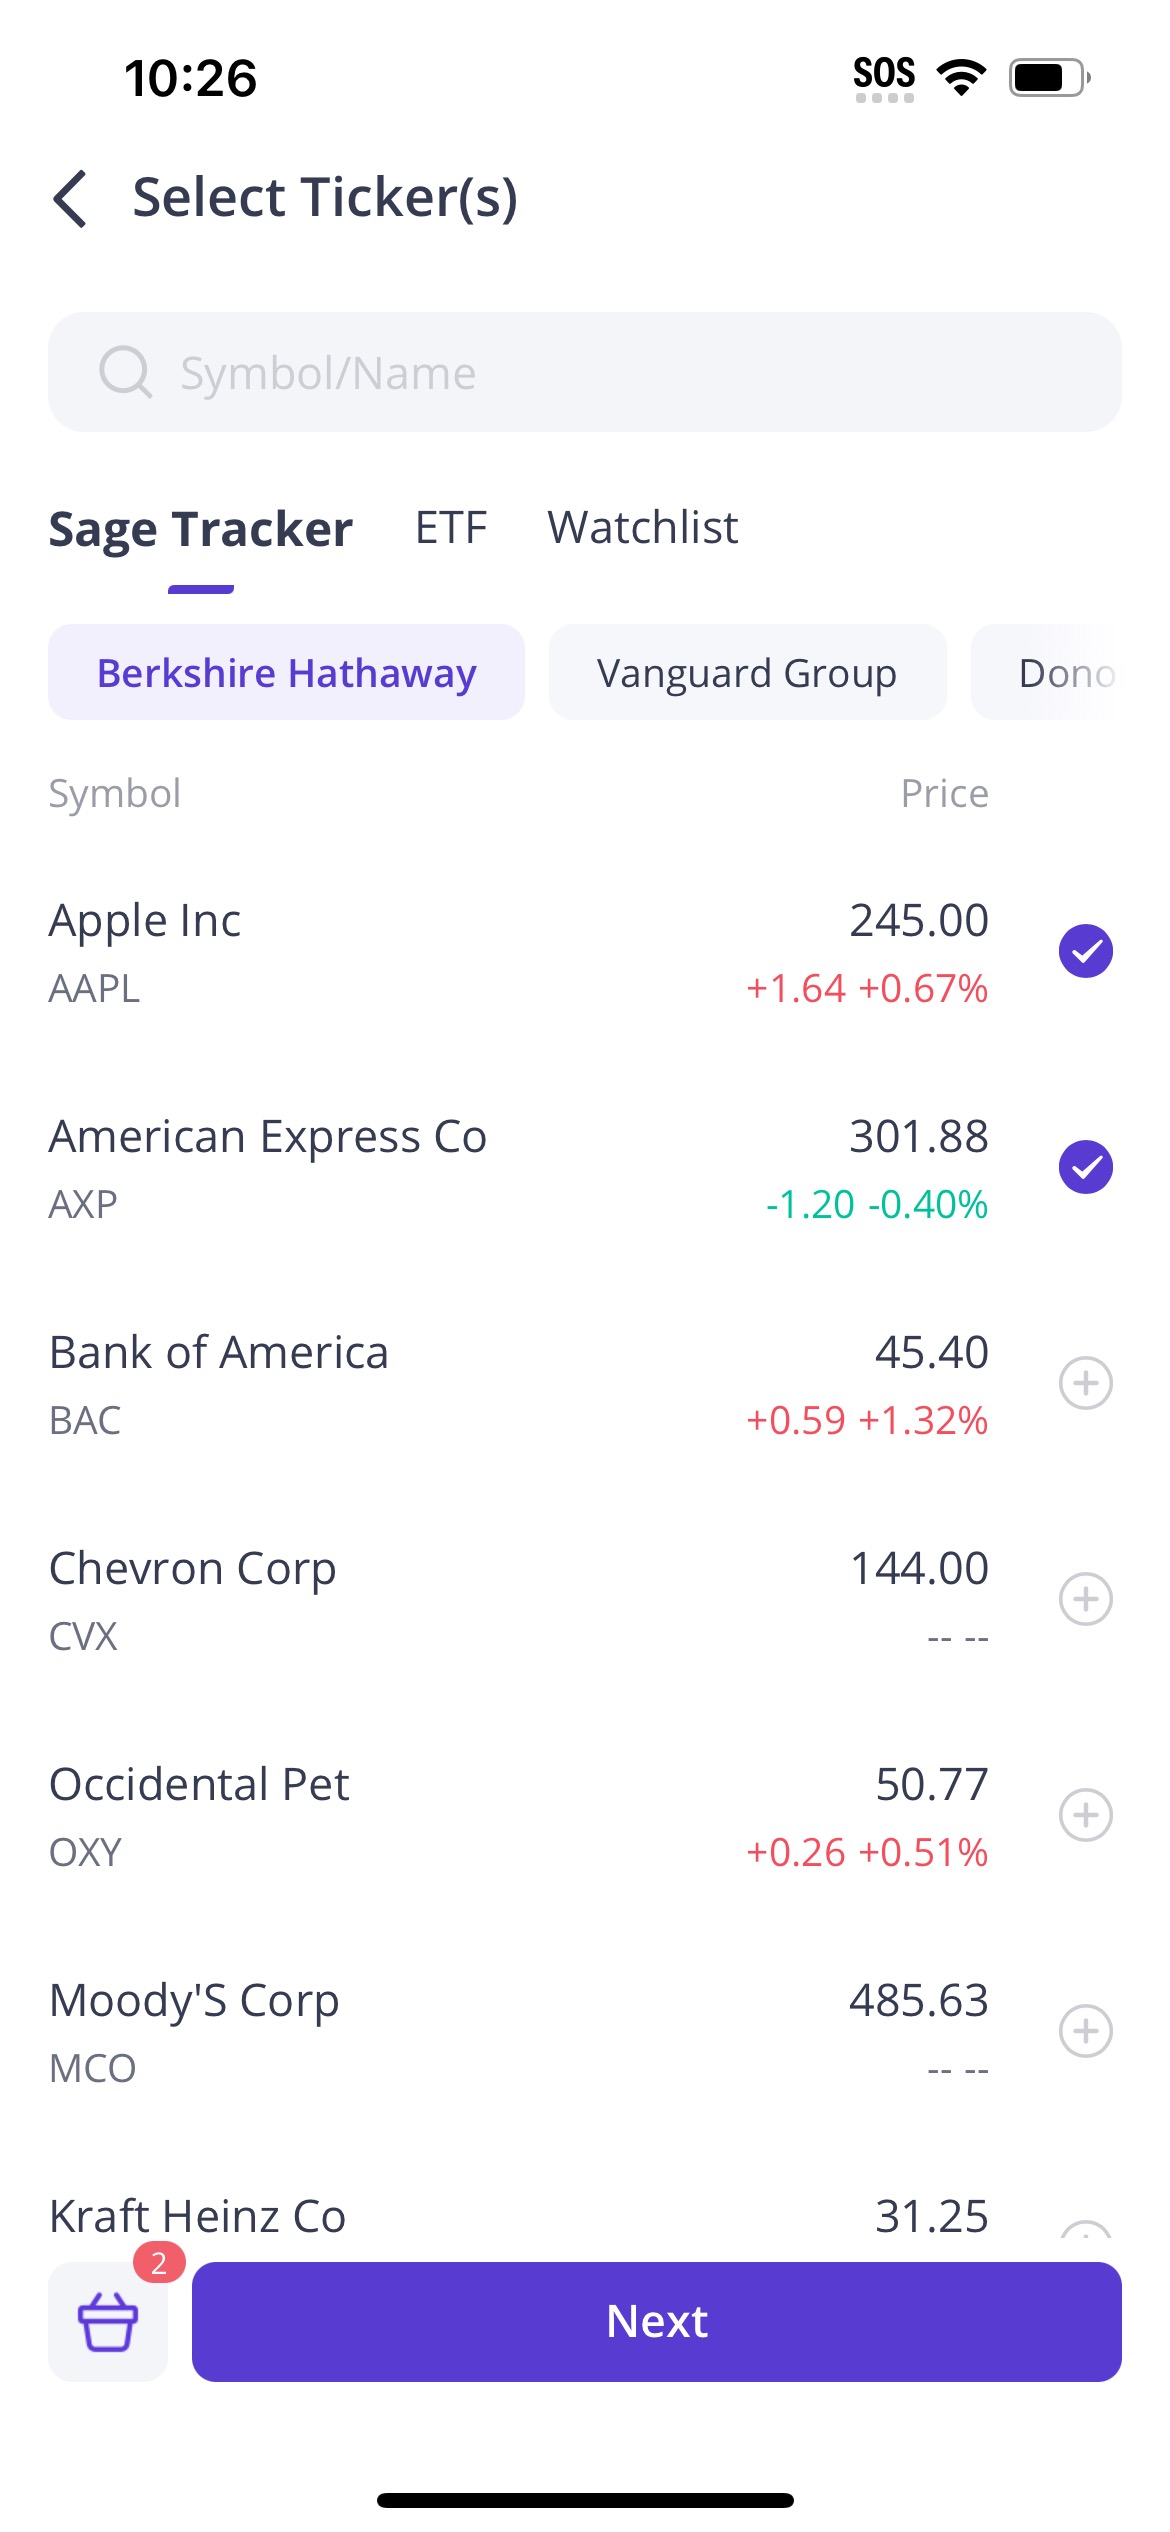
Sage Tracker is an advanced feature within the Webull app that is integrated with DIY Portfolio. It shows the portfolios of well-known investors and institutions, such as Warren Buffet or Goldman Sachs, and the performance of those portfolios over time. This feature allows you to:
- See Institutional Investments: View the stocks that renowned investment institutions hold in their portfolios.
- Select from Expert Lists: Choose from the list of stocks those institutions invest in then select weightings for each security to build your own strategy.
Conclusion
DIY Portfolio is designed to give you the tools and flexibility to take control of your investments. With features such as fractional shares, recurring investments, and advanced back-testing tools, you can build a fully customisable investment strategy that aligns with your financial goals.