

Examining the Future: Fabrinet's Earnings Outlook
Fabrinet (NYSE:FN) is preparing to release its quarterly earnings on Monday, 2025-08-18. Here's a brief overview of what investors should keep in mind before the announcement.
Analysts expect Fabrinet to report an earnings per share (EPS) of $2.54.
The announcement from Fabrinet is eagerly anticipated, with investors seeking news of surpassing estimates and favorable guidance for the next quarter.
It's worth noting for new investors that guidance can be a key determinant of stock price movements.
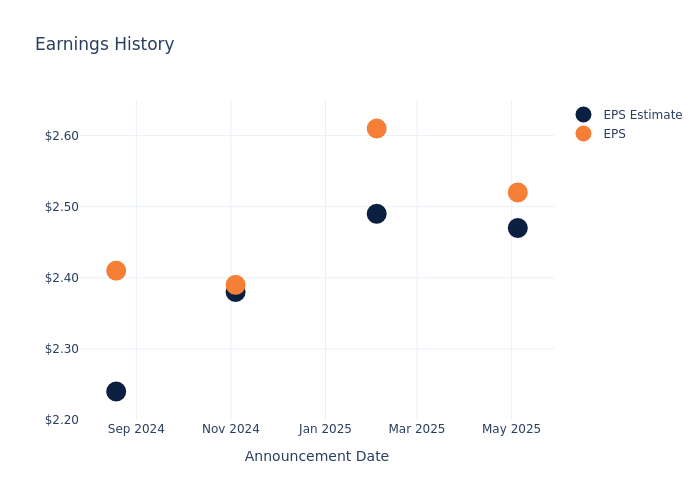
Historical Earnings Performance
The company's EPS beat by $0.05 in the last quarter, leading to a 7.27% drop in the share price on the following day.
Here's a look at Fabrinet's past performance and the resulting price change:
| Quarter | Q3 2025 | Q2 2025 | Q1 2025 | Q4 2024 |
|---|---|---|---|---|
| EPS Estimate | 2.47 | 2.49 | 2.38 | 2.24 |
| EPS Actual | 2.52 | 2.61 | 2.39 | 2.41 |
| Price Change % | -7.000000000000001% | -8.0% | -4.0% | 16.0% |
Performance of Fabrinet Shares
Shares of Fabrinet were trading at $322.08 as of August 14. Over the last 52-week period, shares are up 39.01%. Given that these returns are generally positive, long-term shareholders are likely bullish going into this earnings release.
Analysts' Take on Fabrinet
Understanding market sentiments and expectations within the industry is crucial for investors. This analysis delves into the latest insights on Fabrinet.
A total of 2 analyst ratings have been received for Fabrinet, with the consensus rating being Buy. The average one-year price target stands at $304.0, suggesting a potential 5.61% downside.
Analyzing Analyst Ratings Among Peers
In this analysis, we delve into the analyst ratings and average 1-year price targets of Sanmina, Flex and TTM Technologies, three key industry players, offering insights into their relative performance expectations and market positioning.
- Analysts currently favor an Neutral trajectory for Sanmina, with an average 1-year price target of $110.0, suggesting a potential 65.85% downside.
- Analysts currently favor an Buy trajectory for Flex, with an average 1-year price target of $56.67, suggesting a potential 82.4% downside.
- Analysts currently favor an Buy trajectory for TTM Technologies, with an average 1-year price target of $48.62, suggesting a potential 84.9% downside.
Peer Metrics Summary
The peer analysis summary presents essential metrics for Sanmina, Flex and TTM Technologies, unveiling their respective standings within the industry and providing valuable insights into their market positions and comparative performance.
| Company | Consensus | Revenue Growth | Gross Profit | Return on Equity |
|---|---|---|---|---|
| Fabrinet | Buy | 19.17% | $102.18M | 4.34% |
| Sanmina | Neutral | 10.87% | $181.05M | 3.04% |
| Flex | Buy | 4.13% | $572M | 3.81% |
| TTM Technologies | Buy | 20.74% | $148.11M | 2.58% |
Key Takeaway:
Fabrinet ranks highest in Revenue Growth among its peers. It also leads in Gross Profit margin. However, it has the lowest Return on Equity.
Delving into Fabrinet's Background
Fabrinet provides advanced optical packaging and precision optical, electro-mechanical, and electronic manufacturing services to original equipment manufacturers of complex products, such as optical communication components, modules and sub-systems, industrial lasers, automotive components, medical devices, and sensors. The company offers a broad range of advanced optical and electro-mechanical capabilities across the entire manufacturing process, including process design and engineering, supply chain management, manufacturing, complex printed circuit board assembly, advanced packaging, integration, final assembly, and testing. The company generates the majority of its revenue from North America and Asia-Pacific, with the rest from Europe.
A Deep Dive into Fabrinet's Financials
Market Capitalization: Surpassing industry standards, the company's market capitalization asserts its dominance in terms of size, suggesting a robust market position.
Revenue Growth: Fabrinet's remarkable performance in 3 months is evident. As of 31 March, 2025, the company achieved an impressive revenue growth rate of 19.17%. This signifies a substantial increase in the company's top-line earnings. As compared to competitors, the company surpassed expectations with a growth rate higher than the average among peers in the Information Technology sector.
Net Margin: The company's net margin is a standout performer, exceeding industry averages. With an impressive net margin of 9.32%, the company showcases strong profitability and effective cost control.
Return on Equity (ROE): Fabrinet's ROE stands out, surpassing industry averages. With an impressive ROE of 4.34%, the company demonstrates effective use of equity capital and strong financial performance.
Return on Assets (ROA): Fabrinet's ROA surpasses industry standards, highlighting the company's exceptional financial performance. With an impressive 3.15% ROA, the company effectively utilizes its assets for optimal returns.
Debt Management: Fabrinet's debt-to-equity ratio is below the industry average. With a ratio of 0.0, the company relies less on debt financing, maintaining a healthier balance between debt and equity, which can be viewed positively by investors.
To track all earnings releases for Fabrinet visit their earnings calendar on our site.
This article was generated by Benzinga's automated content engine and reviewed by an editor.