

Analyst Expectations For MetLife's Future
In the preceding three months, 10 analysts have released ratings for MetLife (NYSE:MET), presenting a wide array of perspectives from bullish to bearish.
The table below provides a snapshot of their recent ratings, showcasing how sentiments have evolved over the past 30 days and comparing them to the preceding months.
| Bullish | Somewhat Bullish | Indifferent | Somewhat Bearish | Bearish | |
|---|---|---|---|---|---|
| Total Ratings | 2 | 8 | 0 | 0 | 0 |
| Last 30D | 0 | 1 | 0 | 0 | 0 |
| 1M Ago | 0 | 1 | 0 | 0 | 0 |
| 2M Ago | 2 | 1 | 0 | 0 | 0 |
| 3M Ago | 0 | 5 | 0 | 0 | 0 |
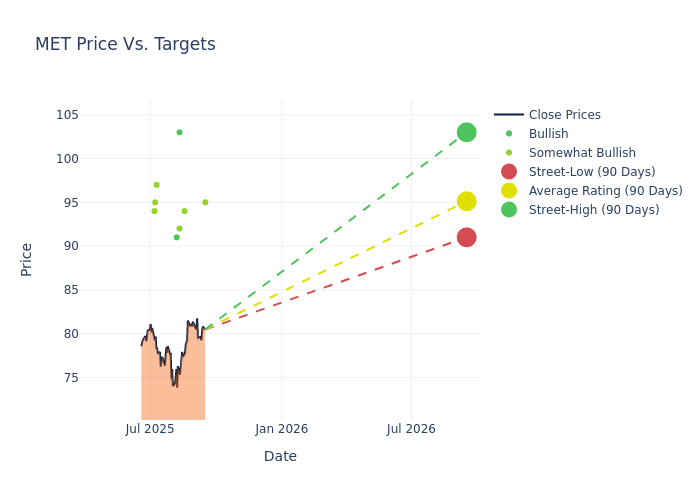
In the assessment of 12-month price targets, analysts unveil insights for MetLife, presenting an average target of $95.3, a high estimate of $103.00, and a low estimate of $91.00. Marking an increase of 1.15%, the current average surpasses the previous average price target of $94.22.
Diving into Analyst Ratings: An In-Depth Exploration
In examining recent analyst actions, we gain insights into how financial experts perceive MetLife. The following summary outlines key analysts, their recent evaluations, and adjustments to ratings and price targets.
| Analyst | Analyst Firm | Action Taken | Rating | Current Price Target | Prior Price Target |
|---|---|---|---|---|---|
| Tracy Benguigui | Wolfe Research | Announces | Outperform | $95.00 | - |
| Nigel Dally | Morgan Stanley | Lowers | Overweight | $94.00 | $98.00 |
| Ryan Krueger | Keefe, Bruyette & Woods | Lowers | Outperform | $92.00 | $94.00 |
| Suneet Kamath | Jefferies | Raises | Buy | $103.00 | $100.00 |
| Brian Meredith | UBS | Lowers | Buy | $91.00 | $94.00 |
| Nigel Dally | Morgan Stanley | Lowers | Overweight | $98.00 | $99.00 |
| Elyse Greenspan | Wells Fargo | Raises | Overweight | $97.00 | $94.00 |
| Ryan Krueger | Keefe, Bruyette & Woods | Lowers | Outperform | $94.00 | $95.00 |
| Jimmy Bhullar | JP Morgan | Raises | Overweight | $95.00 | $86.00 |
| Alex Scott | Barclays | Raises | Overweight | $94.00 | $88.00 |
Key Insights:
- Action Taken: Analysts adapt their recommendations to changing market conditions and company performance. Whether they 'Maintain', 'Raise' or 'Lower' their stance, it reflects their response to recent developments related to MetLife. This information provides a snapshot of how analysts perceive the current state of the company.
- Rating: Offering insights into predictions, analysts assign qualitative values, from 'Outperform' to 'Underperform'. These ratings convey expectations for the relative performance of MetLife compared to the broader market.
- Price Targets: Analysts gauge the dynamics of price targets, providing estimates for the future value of MetLife's stock. This comparison reveals trends in analysts' expectations over time.
To gain a panoramic view of MetLife's market performance, explore these analyst evaluations alongside essential financial indicators. Stay informed and make judicious decisions using our Ratings Table.
Stay up to date on MetLife analyst ratings.
Unveiling the Story Behind MetLife
MetLife is one of the largest life insurers in the US by assets and provides a variety of life insurance and annuity products. It is organized into six segments: Group Benefits, Retirement and Income Solutions, Asia, Latin America, Europe/Middle East/Africa (EMEA), and MetLife Holdings (products in run-off). Group Benefits and RIS are US-based, contributing to around 48% of the firm's 2024 adjusted earnings. The Asia segment contributes around 25% of earnings, mainly tied to Japan. The company also holds leading market positions in Mexico and Chile, with the Latin America segment contributing around 13% of 2024 earnings. The EMEA and MetLife Holdings segments contributed around 4% and 10% of 2024 earnings, respectively.
Financial Milestones: MetLife's Journey
Market Capitalization: Positioned above industry average, the company's market capitalization underscores its superiority in size, indicative of a strong market presence.
Decline in Revenue: Over the 3M period, MetLife faced challenges, resulting in a decline of approximately -1.84% in revenue growth as of 30 June, 2025. This signifies a reduction in the company's top-line earnings. In comparison to its industry peers, the company trails behind with a growth rate lower than the average among peers in the Financials sector.
Net Margin: The company's net margin is below industry benchmarks, signaling potential difficulties in achieving strong profitability. With a net margin of 4.07%, the company may need to address challenges in effective cost control.
Return on Equity (ROE): MetLife's ROE surpasses industry standards, highlighting the company's exceptional financial performance. With an impressive 2.53% ROE, the company effectively utilizes shareholder equity capital.
Return on Assets (ROA): MetLife's ROA excels beyond industry benchmarks, reaching 0.1%. This signifies efficient management of assets and strong financial health.
Debt Management: MetLife's debt-to-equity ratio is notably higher than the industry average. With a ratio of 0.72, the company relies more heavily on borrowed funds, indicating a higher level of financial risk.
What Are Analyst Ratings?
Ratings come from analysts, or specialists within banking and financial systems that report for specific stocks or defined sectors (typically once per quarter for each stock). Analysts usually derive their information from company conference calls and meetings, financial statements, and conversations with important insiders to reach their decisions.
Some analysts publish their predictions for metrics such as growth estimates, earnings, and revenue to provide additional guidance with their ratings. When using analyst ratings, it is important to keep in mind that stock and sector analysts are also human and are only offering their opinions to investors.
Which Stocks Are Analysts Recommending Now?
Benzinga Edge gives you instant access to all major analyst upgrades, downgrades, and price targets. Sort by accuracy, upside potential, and more. Click here to stay ahead of the market.
This article was generated by Benzinga's automated content engine and reviewed by an editor.