

Does J.B. Hunt’s Recent Share Price Surge Still Reflect Its Long Term Value?
- Wondering if J.B. Hunt Transport Services is actually worth its nearly $188 share price, or if the market is getting ahead of itself? Here is a breakdown of what the numbers are really saying about its valuation.
- After a solid run, the stock is up about 7.8% over the last week, 10.2% over the past month, and 9.5% year to date, while delivering a 41.4% gain over five years, which highlights both staying power and shifting sentiment.
- Recent attention has centered on J.B. Hunt's position in reshaping North American freight and intermodal capacity, as shippers continue to rethink their supply chains and routing. From strategic partnerships to network investments, the company has been positioning itself as a go to logistics backbone for large customers, which helps explain the renewed interest in the stock.
- On our framework, J.B. Hunt currently scores a 2 out of 6 valuation check, meaning it looks undervalued on only a couple of metrics. That is why we will walk through multiple valuation approaches next and finish with a more holistic way to think about what the stock is really worth.
J.B. Hunt Transport Services scores just 2/6 on our valuation checks. See what other red flags we found in the full valuation breakdown.
Approach 1: J.B. Hunt Transport Services Discounted Cash Flow (DCF) Analysis
A Discounted Cash Flow model estimates what a business is worth today by projecting its future cash flows and discounting them back to a present value. For J.B. Hunt Transport Services, the model uses a 2 stage Free Cash Flow to Equity approach built on $395.7 Million of last twelve months free cash flow.
Analysts and internal estimates see cash flows rising steadily, with projections reaching around $1.06 Billion by 2029 and continuing to grow modestly into the following decade. While analysts typically provide only a handful of years of explicit forecasts, Simply Wall St extrapolates further using gradually slowing growth assumptions. It then discounts each year back into today’s dollars.
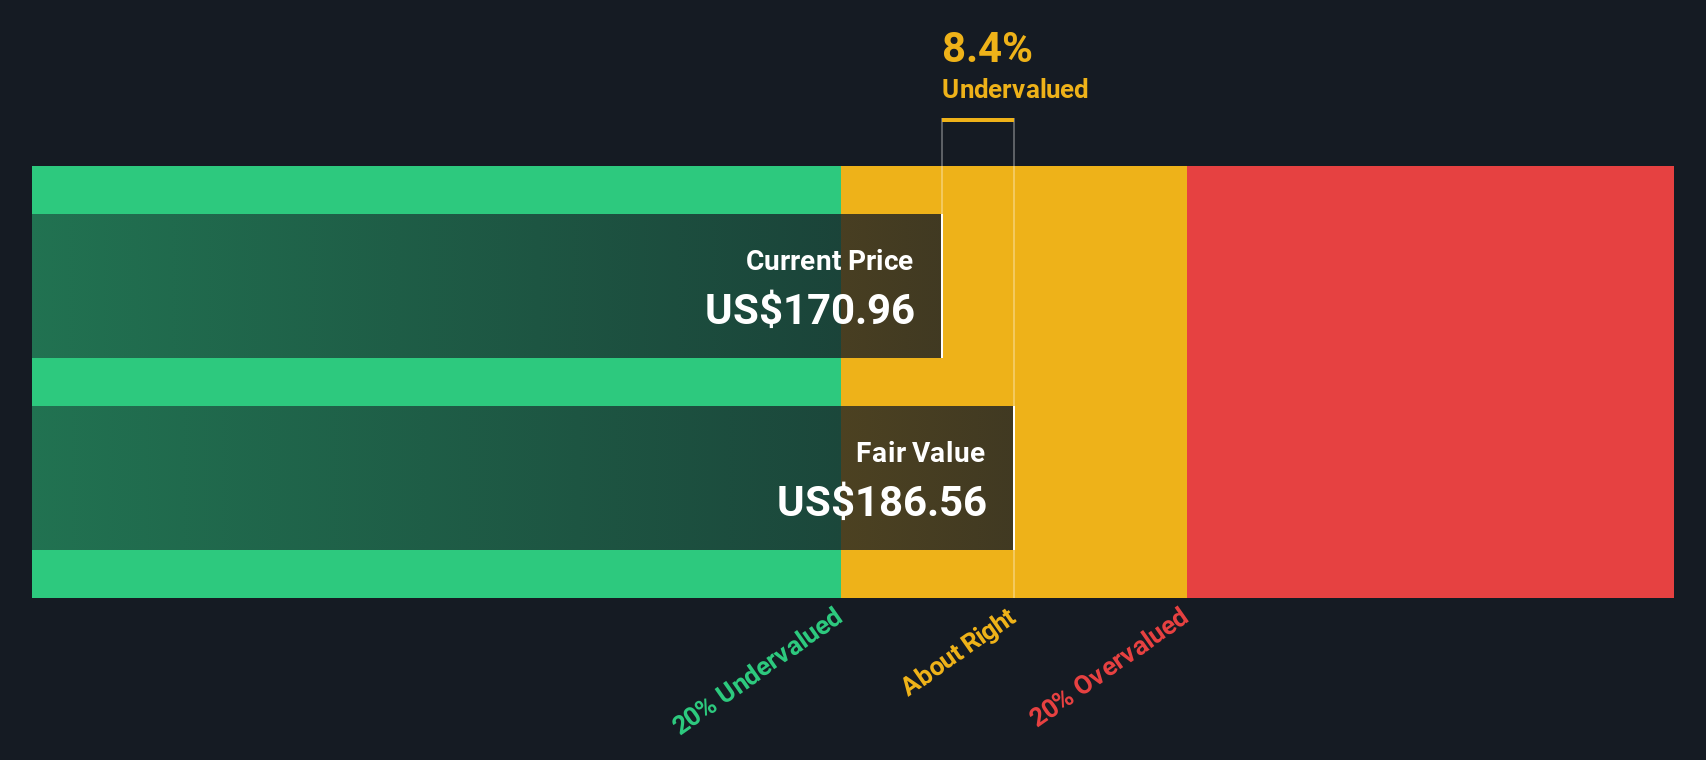
On this basis, the DCF model arrives at an estimated intrinsic value of about $212.59 per share. Compared with the recent share price near $188, the stock screens as roughly 11.8% undervalued. This indicates there may be a reasonable margin of safety for long term investors.
Result: UNDERVALUED
Our Discounted Cash Flow (DCF) analysis suggests J.B. Hunt Transport Services is undervalued by 11.8%. Track this in your watchlist or portfolio, or discover 912 more undervalued stocks based on cash flows.
Approach 2: J.B. Hunt Transport Services Price vs Earnings
For a consistently profitable company like J.B. Hunt Transport Services, the price to earnings, or PE, ratio is a practical way to gauge how much investors are willing to pay for each dollar of current earnings. In general, faster expected earnings growth and lower perceived risk justify a higher PE, while slower growth or higher uncertainty should translate into a lower, more conservative multiple.
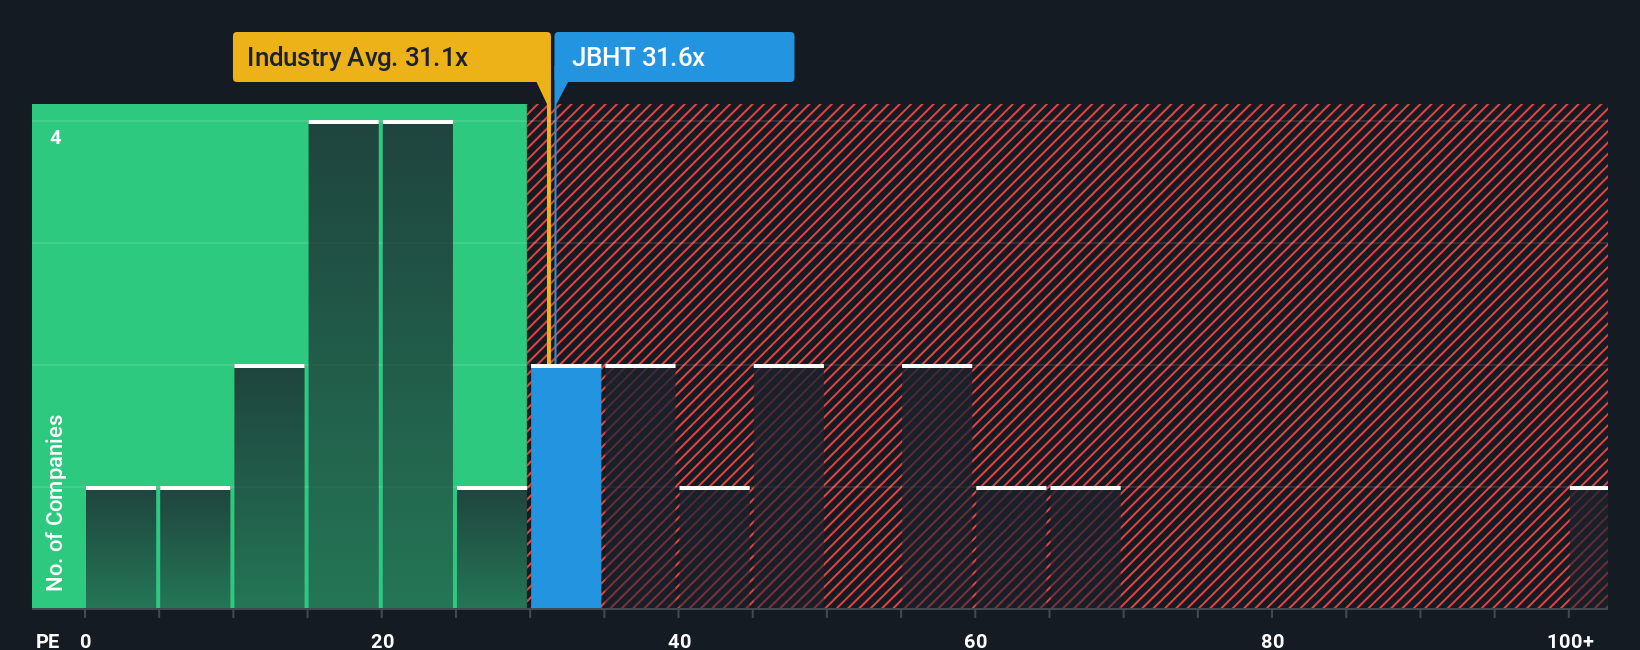
J.B. Hunt currently trades on a PE of about 31.2x, which sits close to the broader Transportation industry average of roughly 30.8x but below the peer group average near 45.7x. At first glance, that suggests the stock is not aggressively priced relative to similar companies and may even trade at a discount to some of its closest peers.
However, Simply Wall St’s Fair Ratio framework estimates a more appropriate PE for J.B. Hunt at around 16.7x, based on its earnings growth outlook, profitability, industry position, market cap and risk profile. Because this tailored Fair Ratio incorporates these fundamentals directly, it offers a more precise benchmark than simple peer or sector comparisons. With the market multiple currently well above this Fair Ratio, the shares look expensive on a pure earnings basis.
Result: OVERVALUED
PE ratios tell one story, but what if the real opportunity lies elsewhere? Discover 1442 companies where insiders are betting big on explosive growth.
Upgrade Your Decision Making: Choose your J.B. Hunt Transport Services Narrative
Earlier we mentioned that there is an even better way to understand valuation, so let us introduce you to Narratives, which are simple stories you create about a company that connect your view of its future revenue, earnings and margins to a concrete fair value estimate and investment plan.
On Simply Wall St’s Community page, used by millions of investors, a Narrative lets you spell out what you think will actually drive J.B. Hunt’s business, translate that story into a forecast, and then compare your Fair Value to today’s share price to decide whether it looks like a buy, hold or sell.
Because Narratives are updated dynamically when new information, such as earnings releases, buyback announcements or major freight news arrives, your valuation automatically reflects the latest data without you needing to rebuild your model from scratch.
For example, one J.B. Hunt Narrative might assume cost efficiencies stick, margins rise toward about 6.2 percent and justify a fair value around $180 per share. A more cautious Narrative might focus on freight demand uncertainty, keep margins closer to 4.6 percent and see fair value nearer $133. Both are valid if they are grounded in clear assumptions you can monitor over time.
Do you think there's more to the story for J.B. Hunt Transport Services? Head over to our Community to see what others are saying!

This article by Simply Wall St is general in nature. We provide commentary based on historical data and analyst forecasts only using an unbiased methodology and our articles are not intended to be financial advice. It does not constitute a recommendation to buy or sell any stock, and does not take account of your objectives, or your financial situation. We aim to bring you long-term focused analysis driven by fundamental data. Note that our analysis may not factor in the latest price-sensitive company announcements or qualitative material. Simply Wall St has no position in any stocks mentioned.
Have feedback on this article? Concerned about the content? Get in touch with us directly. Alternatively, email editorial-team@simplywallst.com