

Does Bristol Myers Squibb’s Recent Rebound Signal a Compelling Long Term Value Opportunity?
- Investors are asking whether Bristol-Myers Squibb at around $51.95 is quietly turning into a value opportunity, or if the market still views it as a trapped big pharma stock.
- After a rough stretch, the share price has bounced, rising 5.5% over the last week and 14.0% over the last month. It is still down 8.5% year to date and 7.3% over the past year, and off 25.7% across three years.
- That recent strength has come as investors refocus on Bristol-Myers Squibb's late-stage drug pipeline and strategic deals, which are seen as important for offsetting patent expiries on some of its older blockbusters. At the same time, big pharma as a group has been back in the spotlight as markets rotate toward more defensive, cash-generative names.
- On our framework it scores 5/6 on valuation checks, which suggests potential undervaluation at current levels. In the next sections we walk through the main valuation methods behind that score, before finishing with a more intuitive way to think about what Bristol-Myers Squibb might really be worth.
Find out why Bristol-Myers Squibb's -7.3% return over the last year is lagging behind its peers.
Approach 1: Bristol-Myers Squibb Discounted Cash Flow (DCF) Analysis
A Discounted Cash Flow model estimates what a company is worth by projecting the cash it can generate in the future and then discounting those cash flows back to today in dollar terms.
For Bristol-Myers Squibb, the latest twelve month free cash flow is about $15.3 billion. Analysts and our 2 Stage Free Cash Flow to Equity model project this to normalize and then trend toward around $11.2 billion by 2029, with further extrapolated estimates reaching roughly $11.1 billion in 2035. Earlier years are expected to see cash flows taper from current elevated levels before stabilizing, reflecting the impact of patent expiries and new product launches.
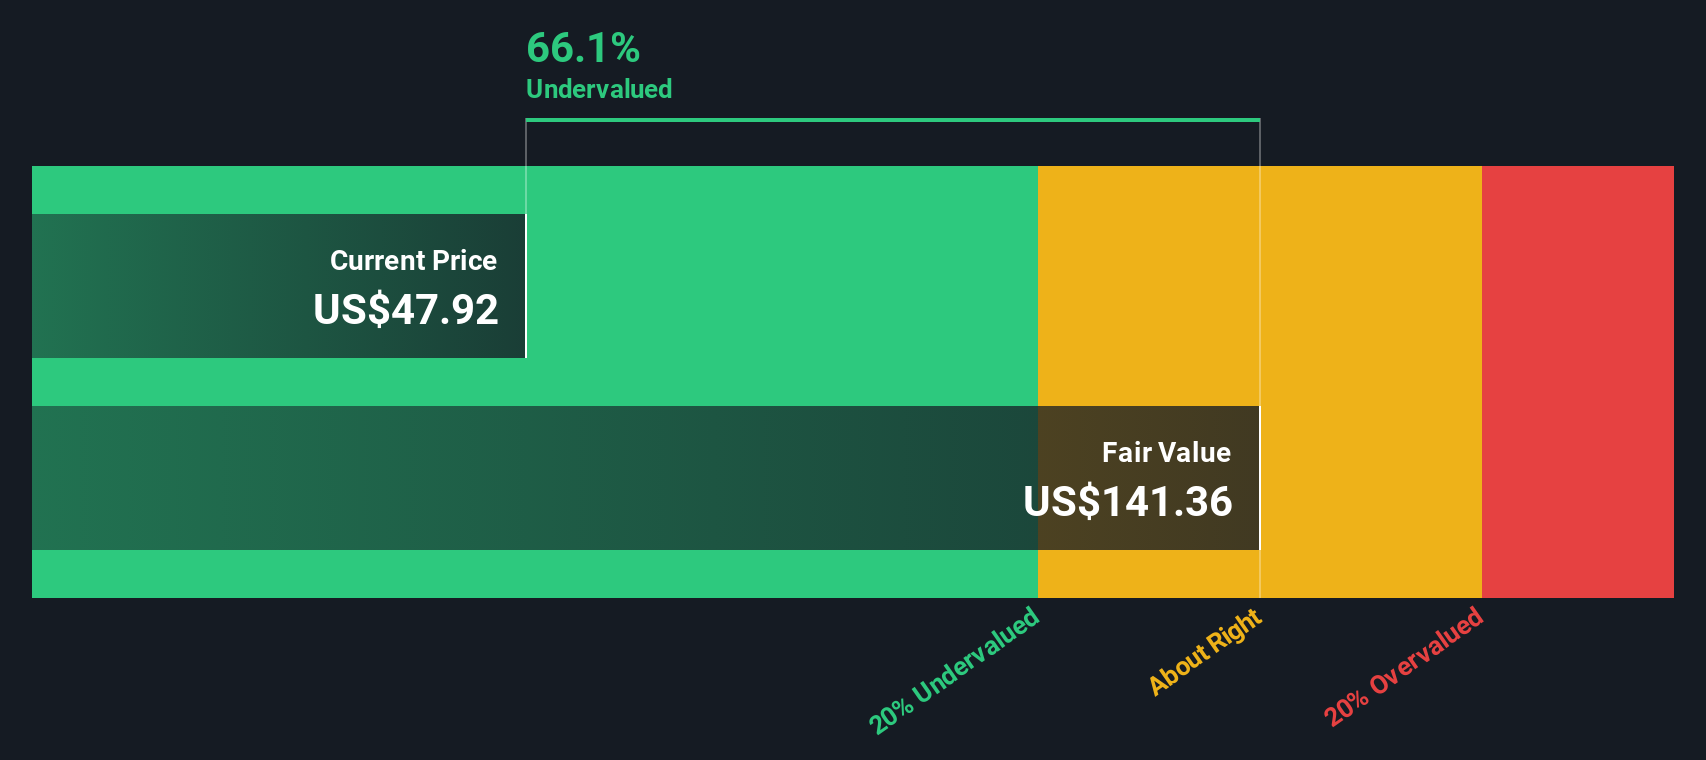
When all of these projected cash flows are discounted back, the DCF model yields an intrinsic value of about $117.66 per share. Compared with a recent share price near $51.95, this implies the stock is roughly 55.8% undervalued on this cash flow view.
Result: UNDERVALUED
Our Discounted Cash Flow (DCF) analysis suggests Bristol-Myers Squibb is undervalued by 55.8%. Track this in your watchlist or portfolio, or discover 912 more undervalued stocks based on cash flows.
Approach 2: Bristol-Myers Squibb Price vs Earnings
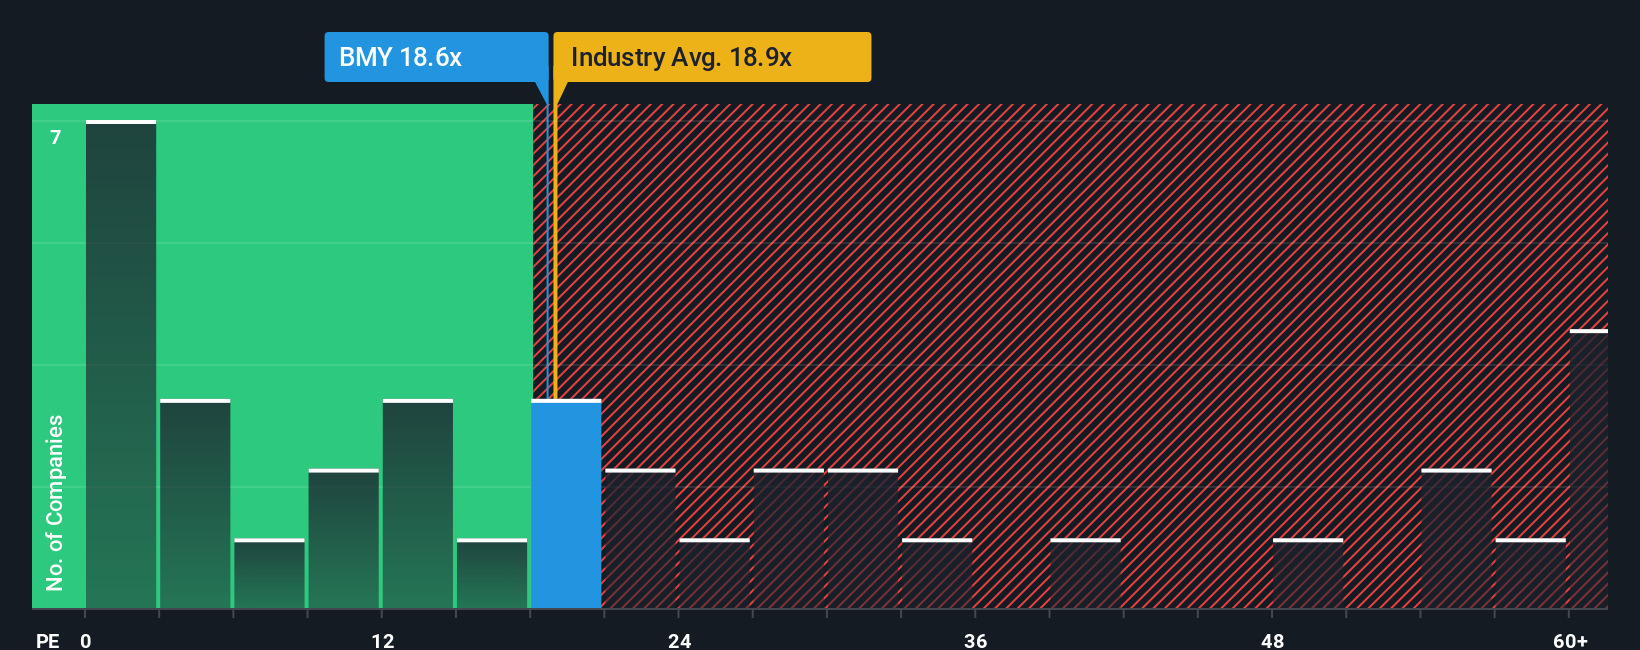
For profitable companies like Bristol-Myers Squibb, the price to earnings ratio is a straightforward way to gauge how much investors are willing to pay for each dollar of current earnings. In general, faster growth and lower perceived risk justify a higher normal PE multiple, while slower, riskier or more cyclical earnings usually command a lower one.
Bristol-Myers Squibb currently trades on a PE of about 17.5x, which is a discount to the broader Pharmaceuticals industry average of roughly 19.7x and even further below the peer group average of around 23.4x. Simply Wall St goes a step further by estimating a Fair Ratio for the stock of about 26.2x, a proprietary view of what its PE should be given its specific earnings growth outlook, profitability, industry positioning, market cap and risk profile. This can be more informative than a simple peer or industry comparison because it adjusts for Bristol-Myers Squibb's own fundamentals rather than assuming all pharma companies deserve the same multiple.
Comparing the current 17.5x PE with the 26.2x Fair Ratio suggests the market is still pricing Bristol-Myers Squibb at a meaningful discount to what its fundamentals might warrant.
Result: UNDERVALUED
PE ratios tell one story, but what if the real opportunity lies elsewhere? Discover 1442 companies where insiders are betting big on explosive growth.
Upgrade Your Decision Making: Choose your Bristol-Myers Squibb Narrative
Earlier we mentioned that there is an even better way to understand valuation. Let us introduce you to Narratives, an approach on Simply Wall St's Community page where you connect your story about Bristol-Myers Squibb to concrete assumptions for future revenue, earnings and margins. These then flow into a financial forecast and a fair value estimate that you can easily compare with the current share price to decide whether it looks like a buy or a sell today. The platform keeps that Narrative dynamically updated as new earnings, guidance or news arrive. For example, one investor might build a more optimistic Narrative that leans on strong 2024 growth, productivity savings and a fair value near $65 per share, while another uses the same tools to frame a more cautious story around patent cliffs and execution risk that supports a fair value closer to $53. This gives you a clear, side by side view of how different perspectives translate into different fair values and decisions.
Do you think there's more to the story for Bristol-Myers Squibb? Head over to our Community to see what others are saying!
This article by Simply Wall St is general in nature. We provide commentary based on historical data and analyst forecasts only using an unbiased methodology and our articles are not intended to be financial advice. It does not constitute a recommendation to buy or sell any stock, and does not take account of your objectives, or your financial situation. We aim to bring you long-term focused analysis driven by fundamental data. Note that our analysis may not factor in the latest price-sensitive company announcements or qualitative material. Simply Wall St has no position in any stocks mentioned.
Have feedback on this article? Concerned about the content? Get in touch with us directly. Alternatively, email editorial-team@simplywallst.com