

Is It Too Late to Consider OSI Systems After Its 2025 Surge in Security Contracts?
- Wondering whether OSI Systems is still a smart buy after its huge run, or if the big gains are already behind it? This article will walk through what the numbers really say about value versus hype.
- The stock is trading around $271.01 after slipping slightly over the last week and month, but it is still up 63.8% year to date and 50.5% over the past year, with a massive 219.3% gain over three years and 193.3% over five.
- Recent moves have been driven by ongoing contract wins in security screening and healthcare technologies, alongside growing interest in infrastructure and border security spending that keeps OSI Systems in focus for long term projects. At the same time, investors are rethinking how durable this demand cycle could be, which feeds directly into how the market is valuing the stock today.
- Despite that strength, OSI Systems currently scores just 1 out of 6 on our valuation checks. This suggests that by traditional metrics it does not screen as obviously undervalued. Next we will break down the different valuation approaches we use, then finish with a more holistic way to judge whether the current price still makes sense.
OSI Systems scores just 1/6 on our valuation checks. See what other red flags we found in the full valuation breakdown.
Approach 1: OSI Systems Discounted Cash Flow (DCF) Analysis
A Discounted Cash Flow model estimates what a business is worth today by projecting its future cash flows and then discounting those back into today’s dollars. For OSI Systems, the model starts with last twelve month Free Cash Flow of about $107.6 Million and builds up a forecast from there.
Analysts and internal estimates see Free Cash Flow rising over time, with projections such as around $302.5 Million in 2026 and roughly $234.1 Million by 2035, all in $. Simply Wall St uses direct analyst forecasts where available, and then extrapolates further years based on more modest growth assumptions to avoid overly optimistic long term expectations.
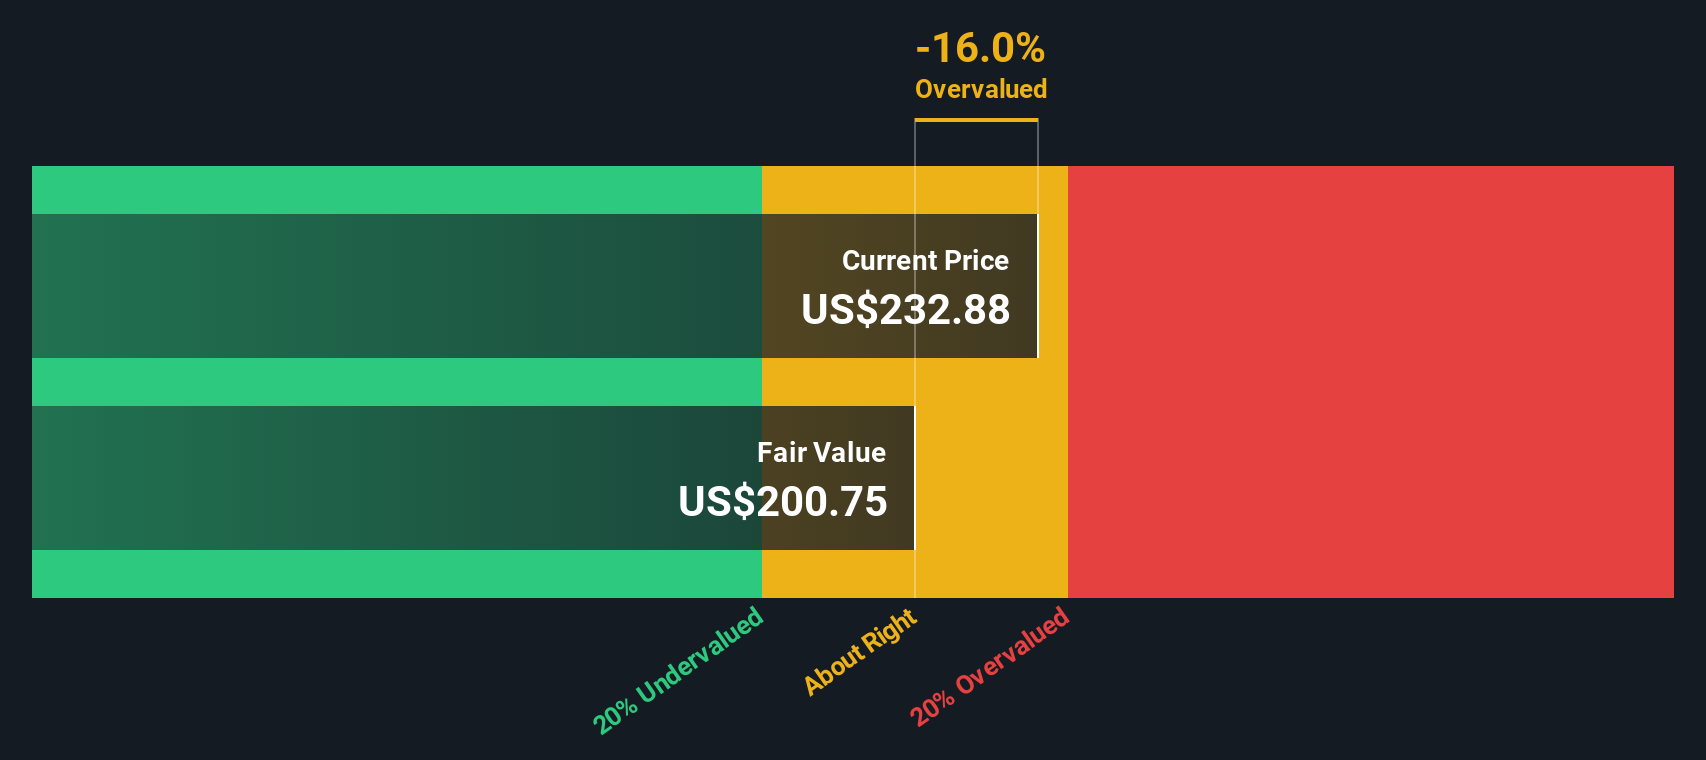
When all of these future cash flows are discounted back using a 2 Stage Free Cash Flow to Equity model, the estimated intrinsic value comes out at about $195.59 per share. With the stock currently trading around $271.01, the DCF suggests that, on this basis, OSI Systems is valued at a level that is approximately 38.6% higher than the model’s estimate of intrinsic value.
Result: OVERVALUED
Our Discounted Cash Flow (DCF) analysis suggests OSI Systems may be overvalued by 38.6%. Discover 912 undervalued stocks or create your own screener to find better value opportunities.
Approach 2: OSI Systems Price vs Earnings
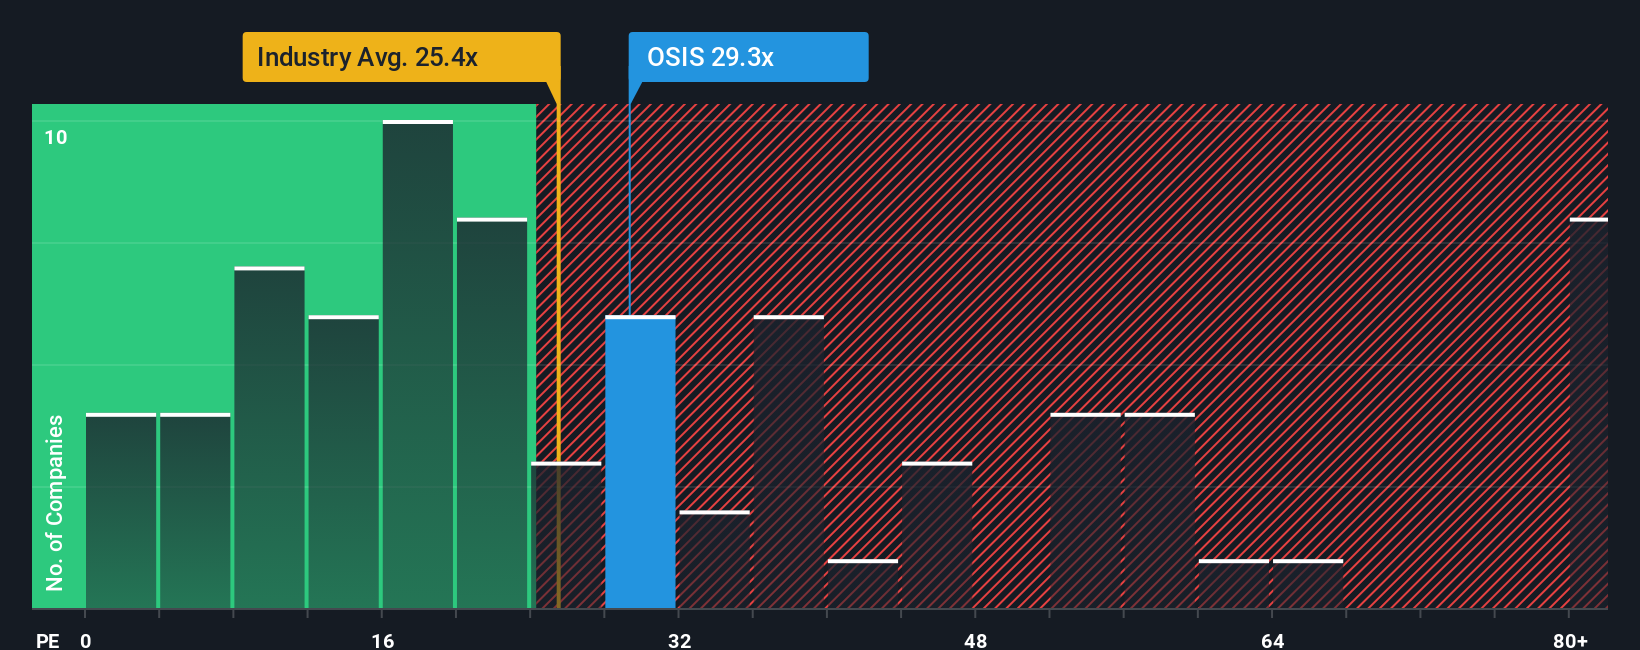
For profitable companies like OSI Systems, the Price to Earnings ratio is a useful way to gauge how much investors are willing to pay today for each dollar of current earnings. In general, faster growing and less risky businesses can justify a higher PE ratio, while slower growth or higher uncertainty usually calls for a lower, more conservative multiple.
OSI Systems currently trades on a PE of about 30.2x. That sits above the broader Electronic industry average of around 24.9x, but below the peer group average of roughly 36.9x. This suggests the market is attaching a reasonably strong growth and quality premium, without becoming extreme versus similar stocks. To go a step further, Simply Wall St calculates a Fair Ratio of about 24.3x, which is the PE you might expect once you factor in OSI Systems earnings growth outlook, profitability, size, industry dynamics and specific risks.
This Fair Ratio is more informative than a simple peer or industry comparison because it is tailored to OSI Systems own fundamentals rather than a one size fits all benchmark. With the actual PE of 30.2x sitting well above the 24.3x Fair Ratio, the multiple points to the shares being priced on the expensive side.
Result: OVERVALUED
PE ratios tell one story, but what if the real opportunity lies elsewhere? Discover 1442 companies where insiders are betting big on explosive growth.
Upgrade Your Decision Making: Choose your OSI Systems Narrative
Earlier we mentioned that there is an even better way to understand valuation, so let us introduce you to Narratives, which are simply investor built stories that connect what you believe about a company’s future to explicit numbers for revenue, earnings, margins and a fair value estimate.
Instead of just accepting one DCF or PE output, a Narrative lets you spell out your thesis, link it to a financial forecast, and automatically translate that into a fair value that you can compare with today’s share price to consider whether OSI Systems fits a buy, hold or sell view.
On Simply Wall St’s Community page, millions of investors use Narratives as an easy, accessible tool that updates dynamically as new earnings, guidance or news arrives. As a result, the fair value behind each story evolves with the facts.
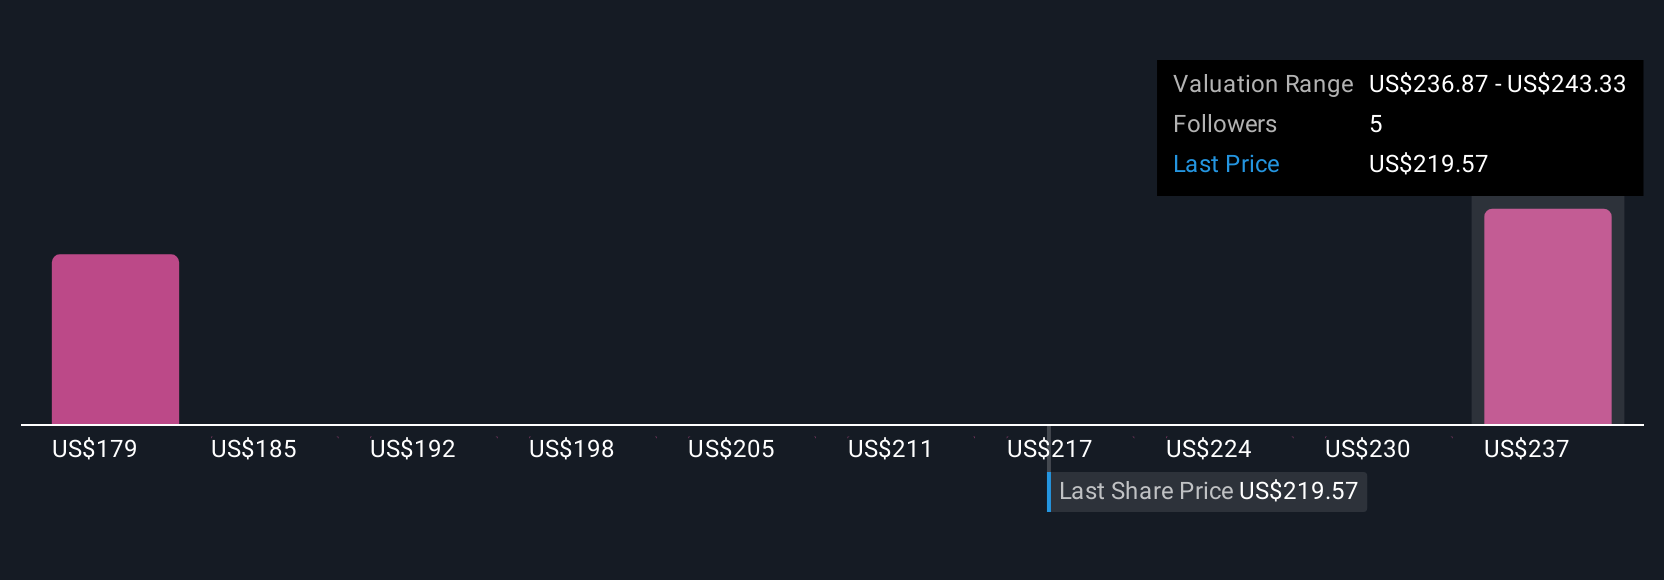
For OSI Systems, one investor’s optimistic Narrative might lean on rising border security spend and service revenues to support a fair value near $295. Another more cautious Narrative could focus on government contract risk and execution challenges to justify a significantly lower value. Narratives make both views transparent and directly comparable.
Do you think there's more to the story for OSI Systems? Head over to our Community to see what others are saying!
This article by Simply Wall St is general in nature. We provide commentary based on historical data and analyst forecasts only using an unbiased methodology and our articles are not intended to be financial advice. It does not constitute a recommendation to buy or sell any stock, and does not take account of your objectives, or your financial situation. We aim to bring you long-term focused analysis driven by fundamental data. Note that our analysis may not factor in the latest price-sensitive company announcements or qualitative material. Simply Wall St has no position in any stocks mentioned.
Have feedback on this article? Concerned about the content? Get in touch with us directly. Alternatively, email editorial-team@simplywallst.com