

Is It Too Late To Consider CenterPoint Energy After Its Strong 2025 Share Price Rally?
- Wondering if CenterPoint Energy at around $38.54 is still worth buying after its strong run, or if most of the upside is already priced in? You are in the right place if you are trying to separate solid value from simple momentum.
- The stock is down about 3.5% over the last week and roughly flat over the past month, but it is still up 22.4% year to date and 23.4% over the last year, with a 5 year gain of just over 100.2%. That mix of near term softness and long term strength is exactly what makes the valuation debate interesting right now.
- Recently, investors have been reacting to a steady flow of regulatory and infrastructure updates that shape expectations for CenterPoint's future cash flows and risk profile. At the same time, broader interest rate and utilities sector sentiment have been shifting, which provides extra context for why the stock has cooled slightly after a strong multi year climb.
- Despite the solid long term share price performance, CenterPoint currently scores just 0/6 on our valuation checks. This suggests that by our core models it does not screen as undervalued yet. Next we will walk through those valuation approaches in detail and then finish with a more holistic way to think about what the market may be missing.
CenterPoint Energy scores just 0/6 on our valuation checks. See what other red flags we found in the full valuation breakdown.
Approach 1: CenterPoint Energy Dividend Discount Model (DDM) Analysis
The Dividend Discount Model estimates what a stock is worth by projecting all future dividends a company is expected to pay and discounting them back to today, essentially asking what those cash payments are worth in today’s dollars.
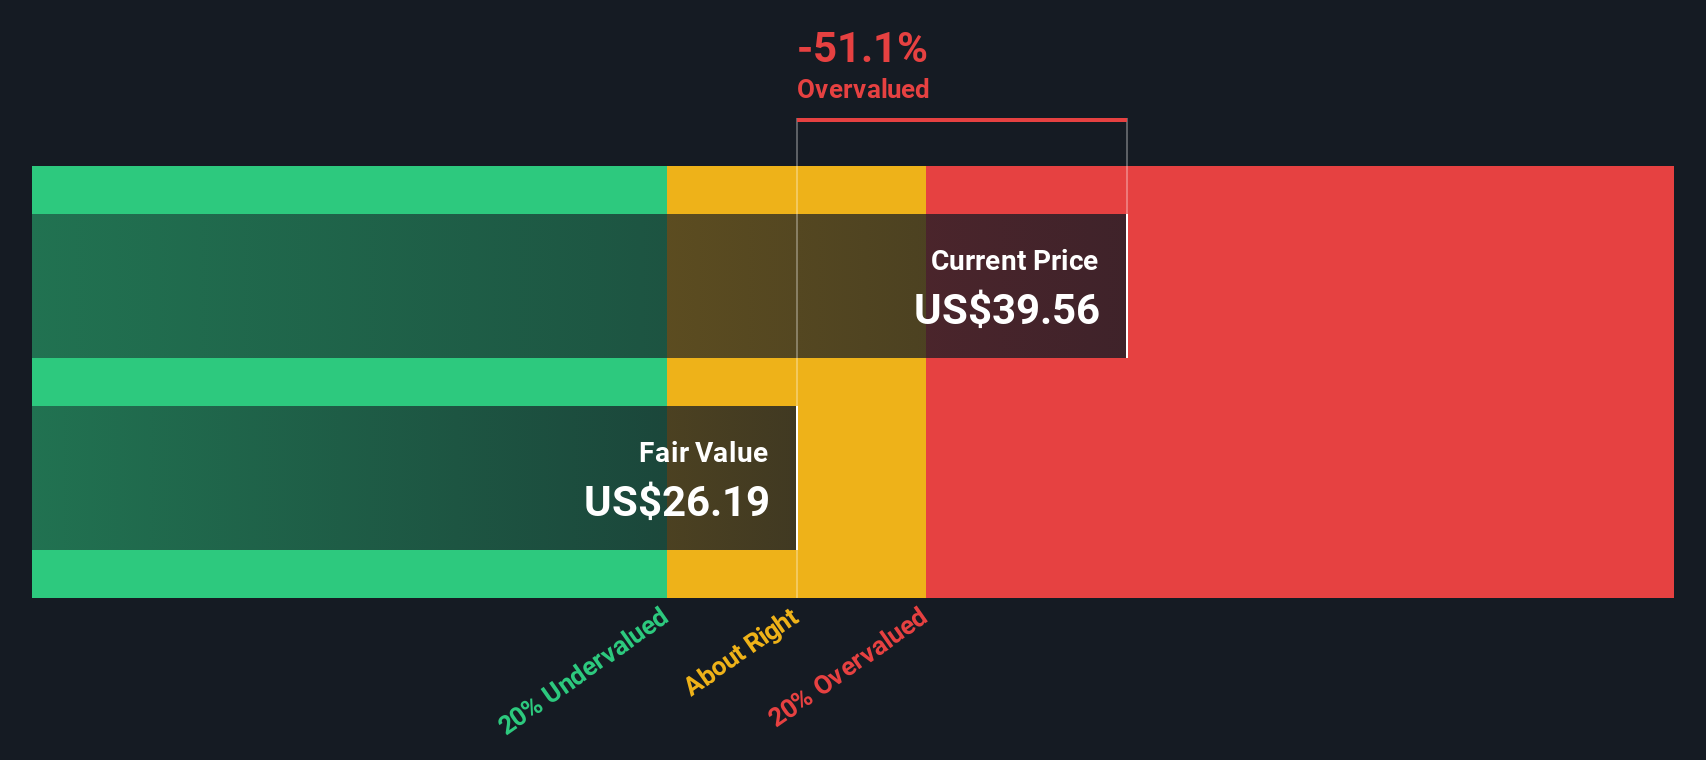
For CenterPoint Energy, the model starts with an annual dividend per share of about $0.97. With a return on equity of roughly 9.3% and a payout ratio near 55%, the dividend appears reasonably covered by earnings rather than being stretched. Simply Wall St caps long term dividend growth at 3.26%, slightly below the raw expected growth rate of about 4.2%, to avoid assuming overly aggressive expansion for a regulated utility.
Using these inputs, the DDM arrives at an intrinsic value of roughly $26.19 per share. Compared with a recent market price around $38.54, that implies the stock is about 47.2% overvalued on this dividend-based lens alone, suggesting investors are currently paying a premium for CenterPoint’s income stream.
Result: OVERVALUED
Our Dividend Discount Model (DDM) analysis suggests CenterPoint Energy may be overvalued by 47.2%. Discover 908 undervalued stocks or create your own screener to find better value opportunities.
Approach 2: CenterPoint Energy Price vs Earnings
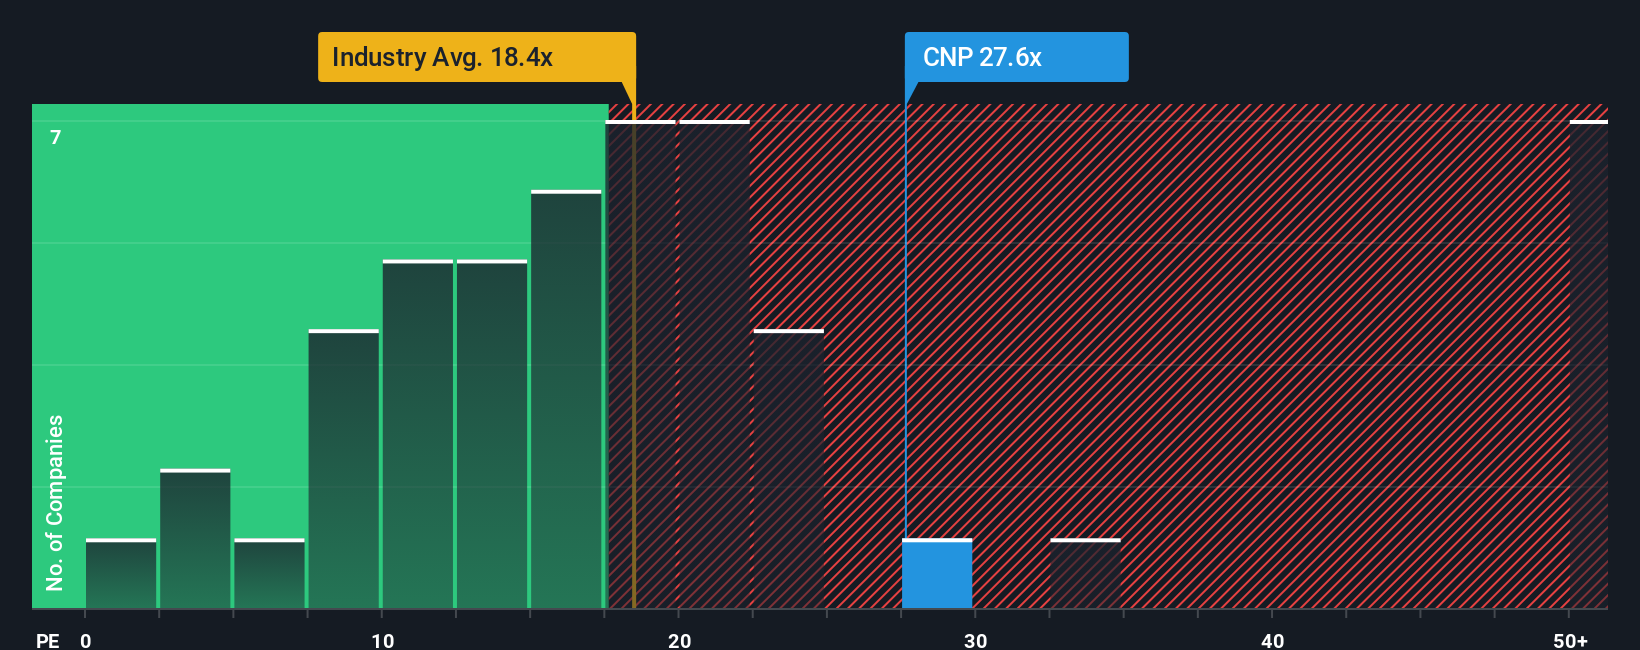
For a profitable utility like CenterPoint Energy, the price to earnings (PE) ratio is a practical way to gauge how much investors are paying for each dollar of current earnings. In general, faster and more reliable earnings growth can justify a higher PE, while slower growth or higher risk should push that multiple lower.
CenterPoint currently trades at about 24.3x earnings, a premium to the broader Integrated Utilities industry average of roughly 17.8x and above the peer group average near 20.8x. To go a step further than these broad comparisons, Simply Wall St calculates a Fair Ratio of 23.8x for CenterPoint. This proprietary measure estimates what PE you would reasonably expect given its specific earnings growth outlook, profit margins, risk profile, industry positioning, and market cap.
Because the Fair Ratio incorporates those company specific drivers, it is often more informative than a simple industry or peer comparison. With CenterPoint’s actual PE sitting only slightly above the 23.8x Fair Ratio, the stock appears marginally expensive on earnings, but not dramatically out of line with what its fundamentals warrant.
Result: OVERVALUED
PE ratios tell one story, but what if the real opportunity lies elsewhere? Discover 1442 companies where insiders are betting big on explosive growth.
Upgrade Your Decision Making: Choose your CenterPoint Energy Narrative
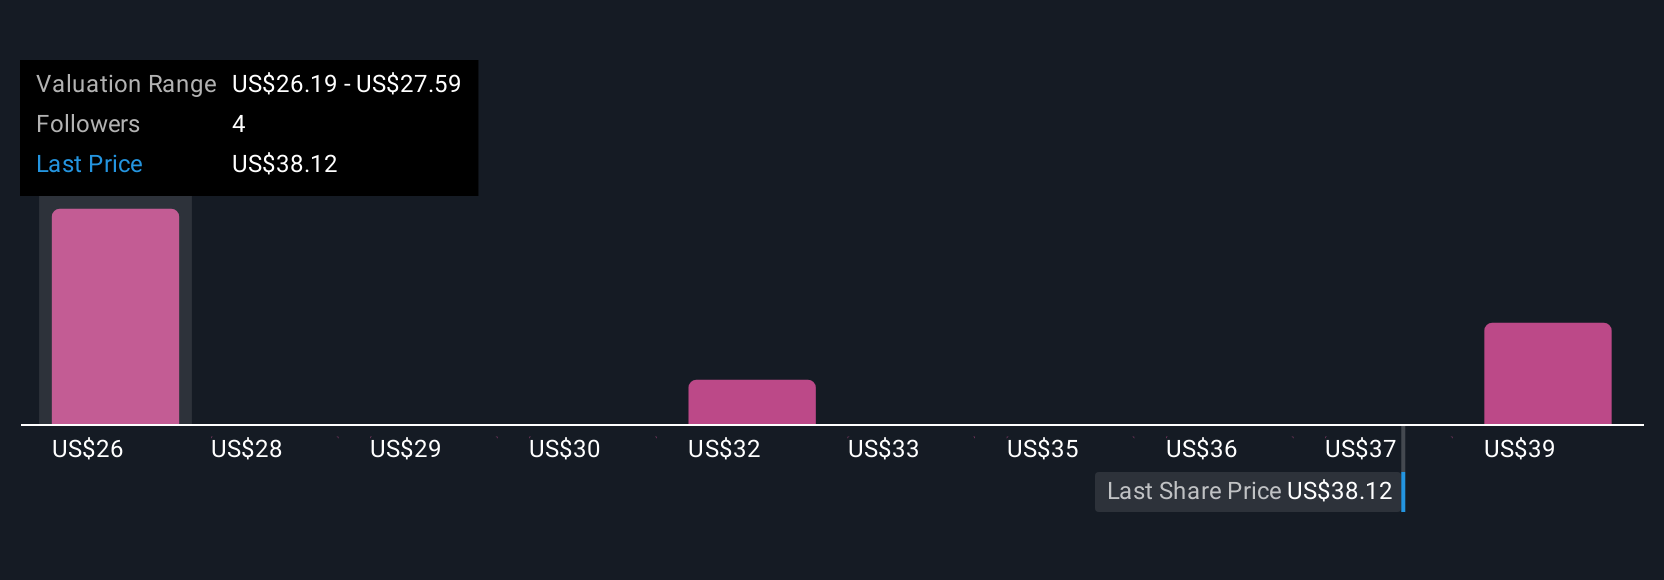
Earlier we mentioned that there is an even better way to understand valuation, so let us introduce you to Narratives, a simple way to connect your view of CenterPoint’s story with a concrete forecast and a fair value, by writing down what you believe about its future revenues, earnings and margins, and then comparing that fair value to today’s price to decide whether to buy, hold or sell. On Simply Wall St’s Community page, used by millions of investors, Narratives turn your assumptions into living valuation models that update dynamically as new news, earnings and regulatory developments arrive, so your thesis is never static. For example, one investor might craft a bullish CenterPoint Narrative that focuses on accelerating industrial demand, resilient grid investment and a fair value closer to $44. Another, more cautious investor might emphasize regulatory risk, higher debt costs and slower growth to arrive nearer $34. Both perspectives can coexist and evolve as fresh information shifts the balance of probabilities.
Do you think there's more to the story for CenterPoint Energy? Head over to our Community to see what others are saying!
This article by Simply Wall St is general in nature. We provide commentary based on historical data and analyst forecasts only using an unbiased methodology and our articles are not intended to be financial advice. It does not constitute a recommendation to buy or sell any stock, and does not take account of your objectives, or your financial situation. We aim to bring you long-term focused analysis driven by fundamental data. Note that our analysis may not factor in the latest price-sensitive company announcements or qualitative material. Simply Wall St has no position in any stocks mentioned.
Have feedback on this article? Concerned about the content? Get in touch with us directly. Alternatively, email editorial-team@simplywallst.com