

Is There Still Upside in Gilead After Its Strong Multi Year Share Price Rally?
- If you are wondering whether Gilead Sciences is still attractively priced today or whether most of the upside is already reflected in the share price, this article will walk you through what the numbers indicate about its current value.
- After climbing 31.9% year to date and 35.5% over the last year, with the share price now around $121.22, Gilead’s recent pullback of 3.7% over the past week and modest 2.0% gain over the last month suggest that investors are reassessing both its growth story and its risk profile.
- Recent headlines have focused on Gilead’s expanding oncology and HIV treatment pipeline, along with ongoing regulatory milestones and collaboration deals that aim to deepen its footprint in high value therapeutic areas. These developments help explain why the stock has delivered multi year returns of 53.4% over three years and 142.9% over five years, even as short term sentiment occasionally cools.
- Right now, Gilead scores a solid 5/6 on our valuation checks, suggesting that the market may still be underestimating parts of its cash flow and asset base. In this article, we break that down using multiple valuation approaches, then circle back at the end to a more intuitive way to think about what the stock might be worth.
Approach 1: Gilead Sciences Discounted Cash Flow (DCF) Analysis
A Discounted Cash Flow model estimates what a company is worth by projecting the cash it can generate in the future and then discounting those cash flows back to today. For Gilead Sciences, the model used is a 2 Stage Free Cash Flow to Equity approach based on cash flow projections.
Gilead generated about $9.1 billion in free cash flow over the last twelve months, and analyst projections plus Simply Wall St extrapolations see this rising to roughly $17.7 billion by 2035. These growing cash flows are discounted back into today’s dollars to estimate what all that future cash is worth to shareholders now, using assumptions about risk and long term growth.
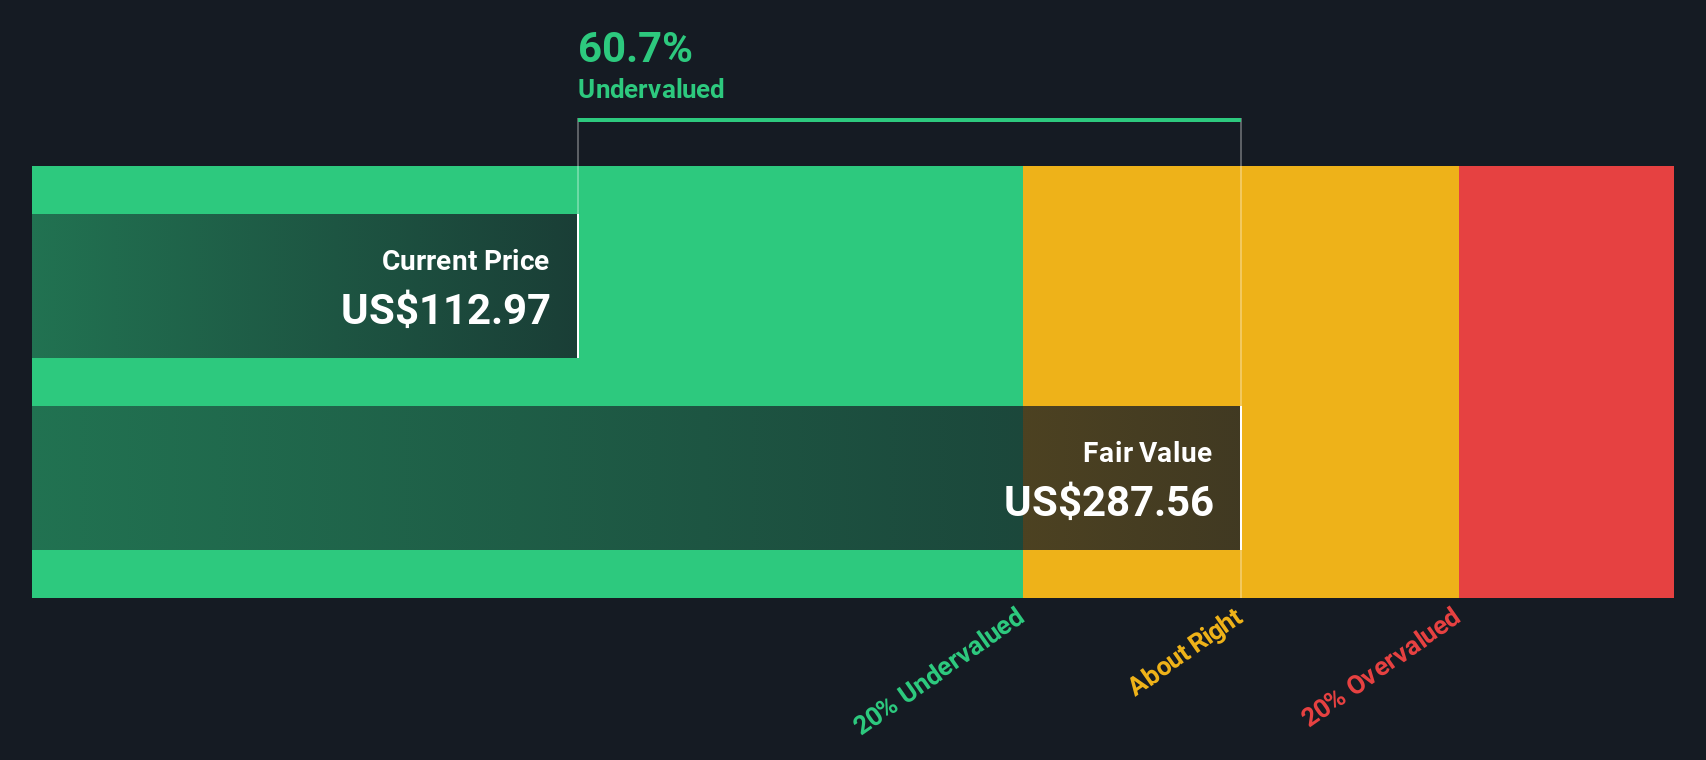
On this basis, the DCF model arrives at an intrinsic value of about $262 per share, compared with the current share price of roughly $121. This implies the stock is trading at about a 53.7% discount to its estimated fair value, indicating that the market is heavily discounting Gilead’s future cash generation potential.
Result: UNDERVALUED
Our Discounted Cash Flow (DCF) analysis suggests Gilead Sciences is undervalued by 53.7%. Track this in your watchlist or portfolio, or discover 908 more undervalued stocks based on cash flows.
Approach 2: Gilead Sciences Price vs Earnings
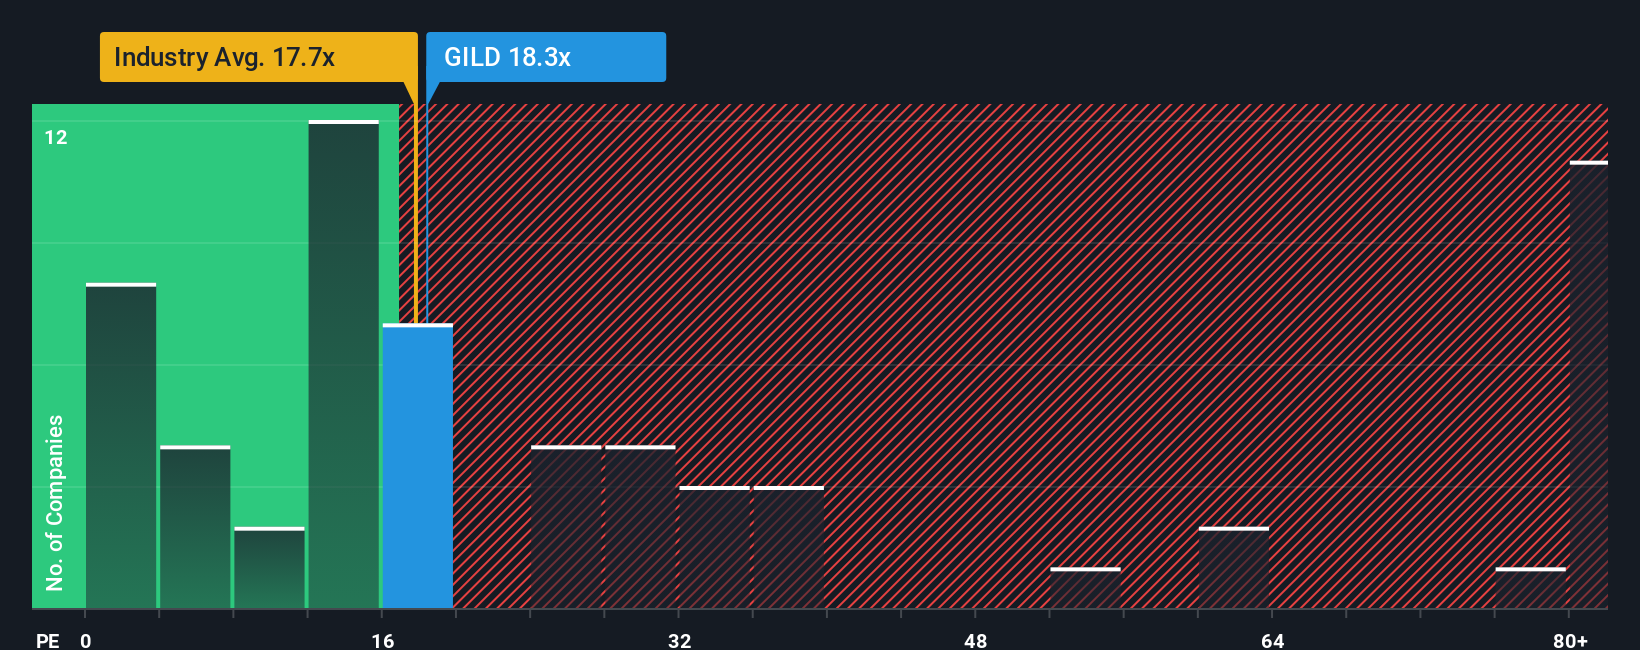
For a consistently profitable business like Gilead Sciences, the price to earnings, or PE, ratio is a useful way to judge whether investors are paying a reasonable price for each dollar of earnings. In general, companies with stronger, more reliable growth and lower perceived risk can justify a higher PE, while slower growing or riskier businesses tend to trade on lower multiples.
Gilead currently trades on a PE of about 18.5x, which is slightly below the Biotechs industry average of around 19.1x and far below the broader peer group average of roughly 60.8x. On the surface, this suggests Gilead is not being priced like the more aggressively valued names in its space.
Simply Wall St’s Fair Ratio for Gilead is 28.2x, a proprietary estimate of what its PE should be after accounting for factors such as earnings growth prospects, profitability, industry dynamics, market cap and specific risks. Because it blends these fundamentals into a single benchmark, the Fair Ratio is often more informative than a simple comparison with peers or the industry, which can be skewed by outliers or different risk profiles. With the current PE of 18.5x sitting well below the 28.2x Fair Ratio, the multiple analysis points to Gilead being undervalued on earnings.
Result: UNDERVALUED
PE ratios tell one story, but what if the real opportunity lies elsewhere? Discover 1452 companies where insiders are betting big on explosive growth.
Upgrade Your Decision Making: Choose your Gilead Sciences Narrative
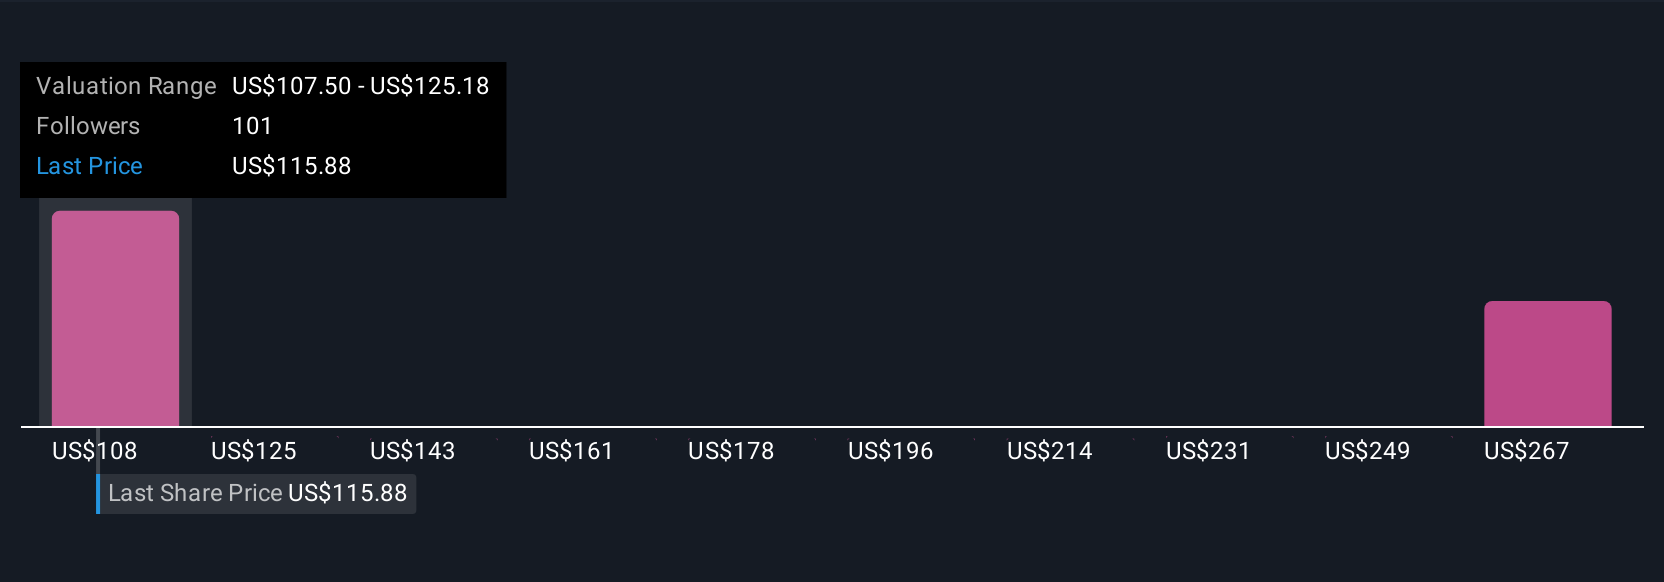
Earlier we mentioned that there is an even better way to understand valuation, so let us introduce you to Narratives, a simple way to connect your view of Gilead Sciences with the numbers behind its fair value. A Narrative is the story you believe about a company, captured as your assumptions for future revenue, earnings and margins, and then translated into a financial forecast and a specific fair value. On Simply Wall St, Narratives are an easy to use tool within the Community page that millions of investors use to turn their qualitative opinions into quantitative, comparable scenarios. Each Narrative calculates a Fair Value and lines it up against today’s share price, helping you assess whether Gilead looks attractive, fairly valued or unattractive for your assumptions. Because Narratives update automatically when new news, earnings or guidance arrive, your fair value view stays current without you rebuilding a model from scratch. For example, one Gilead Narrative might assume fair value closer to the low analyst target near $91 while another leans toward a more optimistic view around $140, reflecting very different expectations about how its HIV and oncology franchises play out.
Do you think there's more to the story for Gilead Sciences? Head over to our Community to see what others are saying!
This article by Simply Wall St is general in nature. We provide commentary based on historical data and analyst forecasts only using an unbiased methodology and our articles are not intended to be financial advice. It does not constitute a recommendation to buy or sell any stock, and does not take account of your objectives, or your financial situation. We aim to bring you long-term focused analysis driven by fundamental data. Note that our analysis may not factor in the latest price-sensitive company announcements or qualitative material. Simply Wall St has no position in any stocks mentioned.
Have feedback on this article? Concerned about the content? Get in touch with us directly. Alternatively, email editorial-team@simplywallst.com